
Rewind all of Windows, from the crash back to its cause
Malware, exploits and drivers leave their evidence across processes and into the kernel. Epoch records the whole system once, so you and an AI agent can go back from a crash to its cause, and prove every finding at the exact instruction.
Rewind all of Windows, from the crash back to its cause
Malware, exploits and drivers leave their evidence across processes and into the kernel. Epoch records the whole system once, so you and an AI agent can go back from a crash to its cause, and prove every finding at the exact instruction.


Where Windows investigations get stuck
The real code only appears at runtime
Packed stages, encrypted strings and injected code only appear at runtime. The code you read isn’t always the code that ran.
The sample detects your debugger
The sample can spot the debugger, one step too far means starting over, and the next run may not behave the same way.
The attack leaves the process
You can rewind, but only inside one user-mode process. An injection into another process, a driver call or a bugcheck stays outside the recording.
Record once, analyse it anytime.
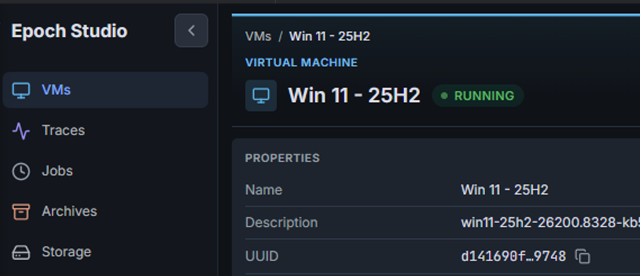
Lite VM builds a Windows VM that’s ready to record, in about half an hour, for any version up to Windows 11. Already have a Windows VM? Import it into Epoch.
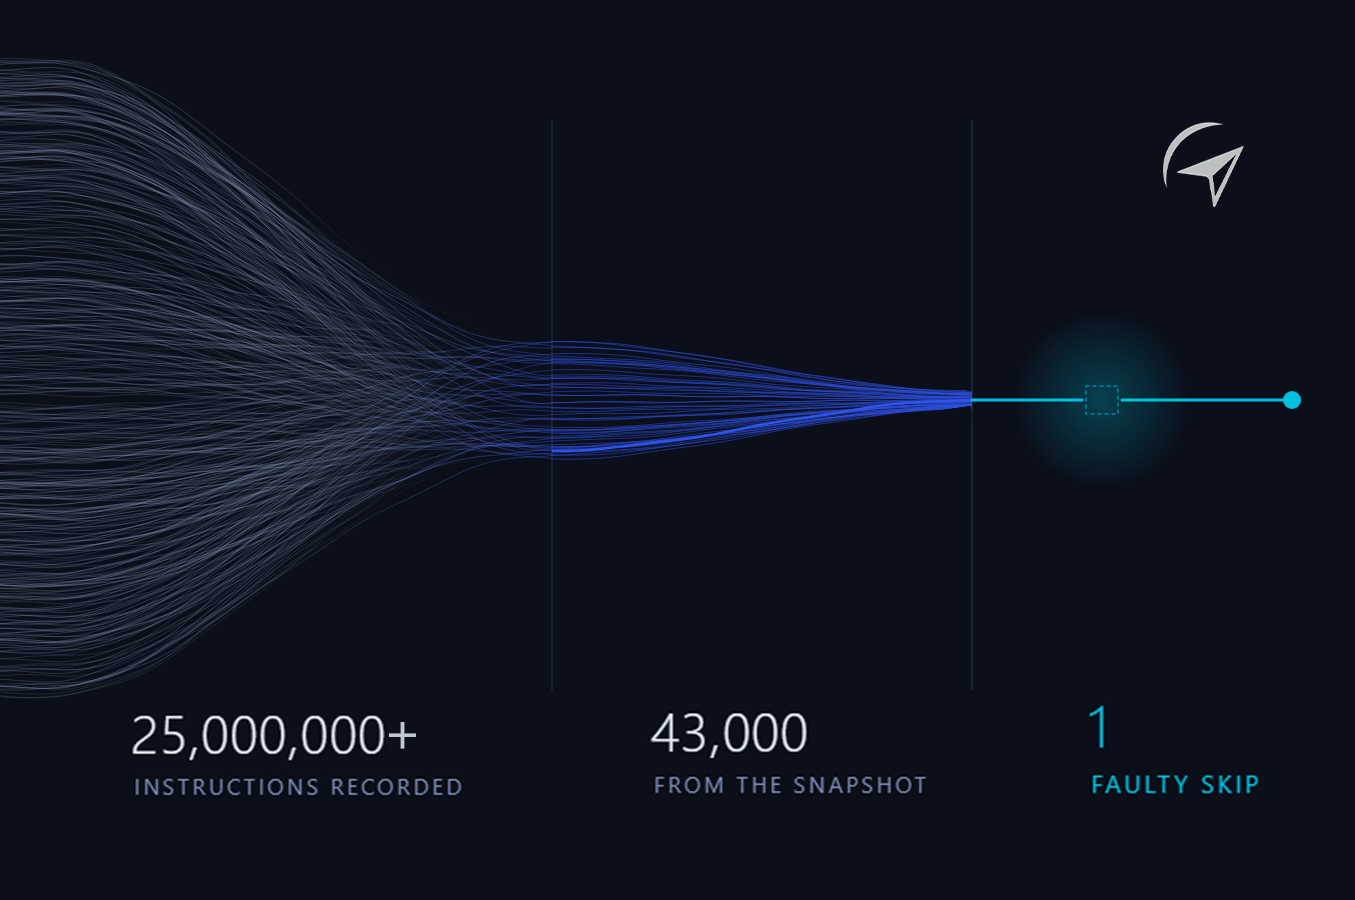
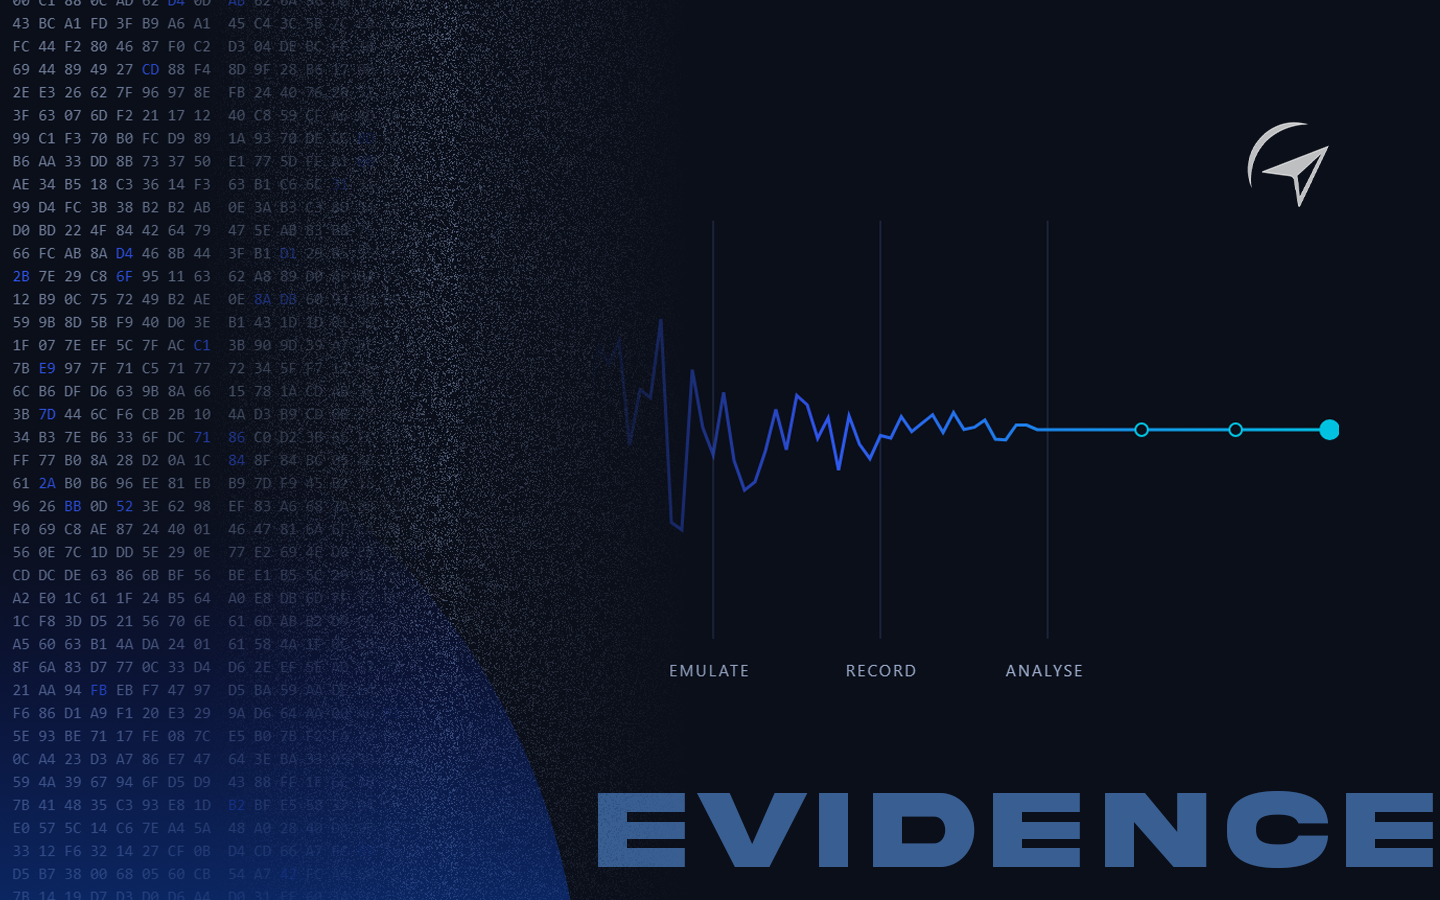
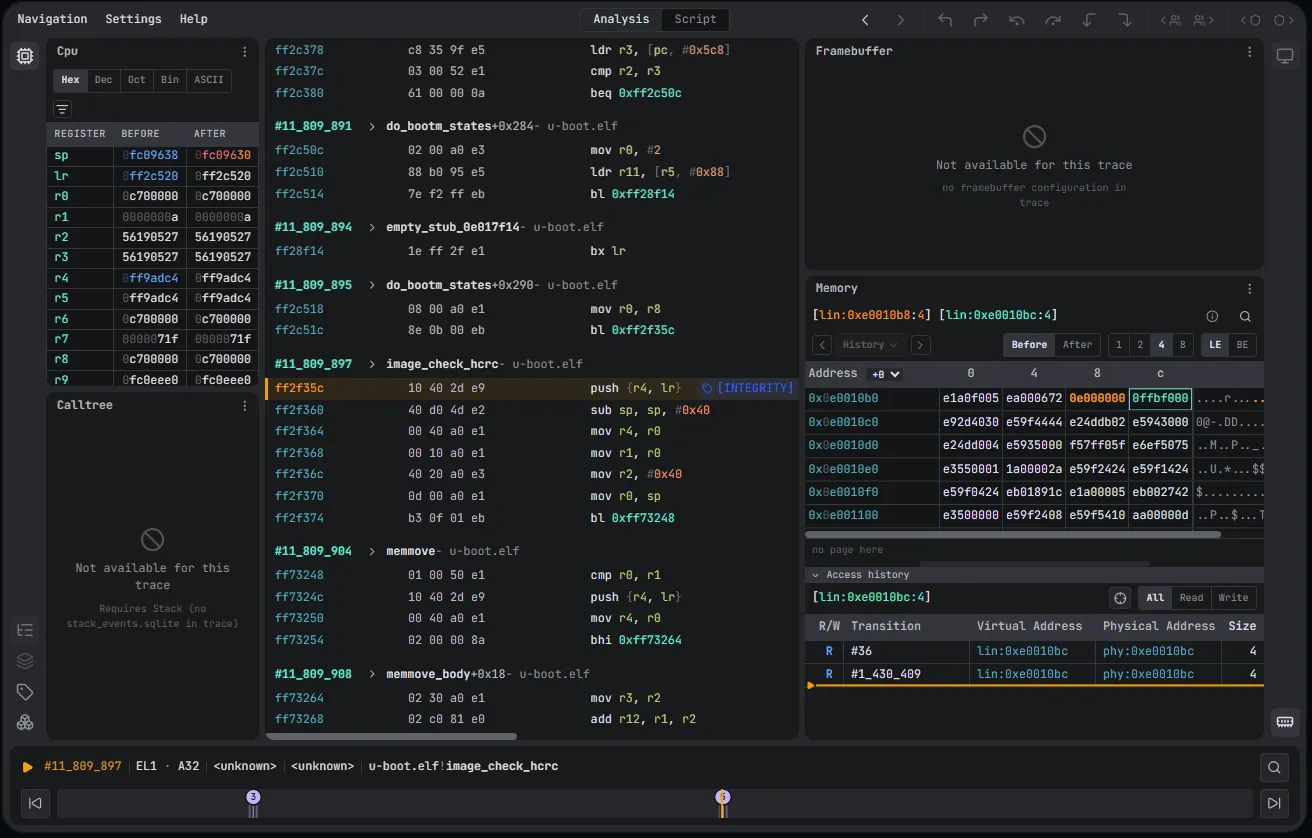
Epoch records the whole VM in one trace, from the kernel to userland: every instruction, register and memory access, across every process and driver. Once it’s recorded, you can analyse the run for as long as you need.
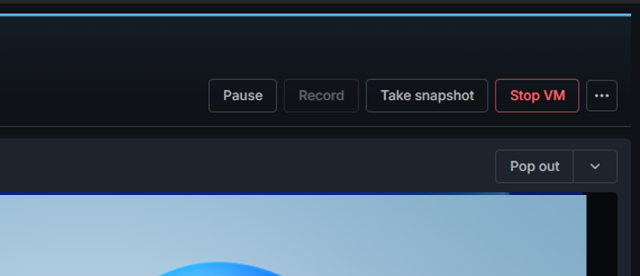
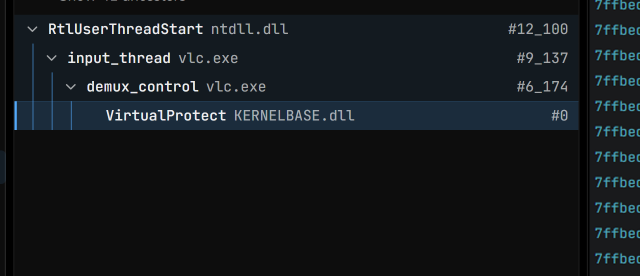
In Epoch, move backwards from the crash to its cause. Follow the call tree, see every read and write to an address, search the whole trace for a string, and tag the moments that matter so your team can find them.
Explore a real Windows trace, for free.
Get familiar with Epoch and time travel debugging: move backwards and forwards through AngryPangolin, a Windows challenge whose key check is split between a user-mode program and a kernel driver.
Go to the live demo ↗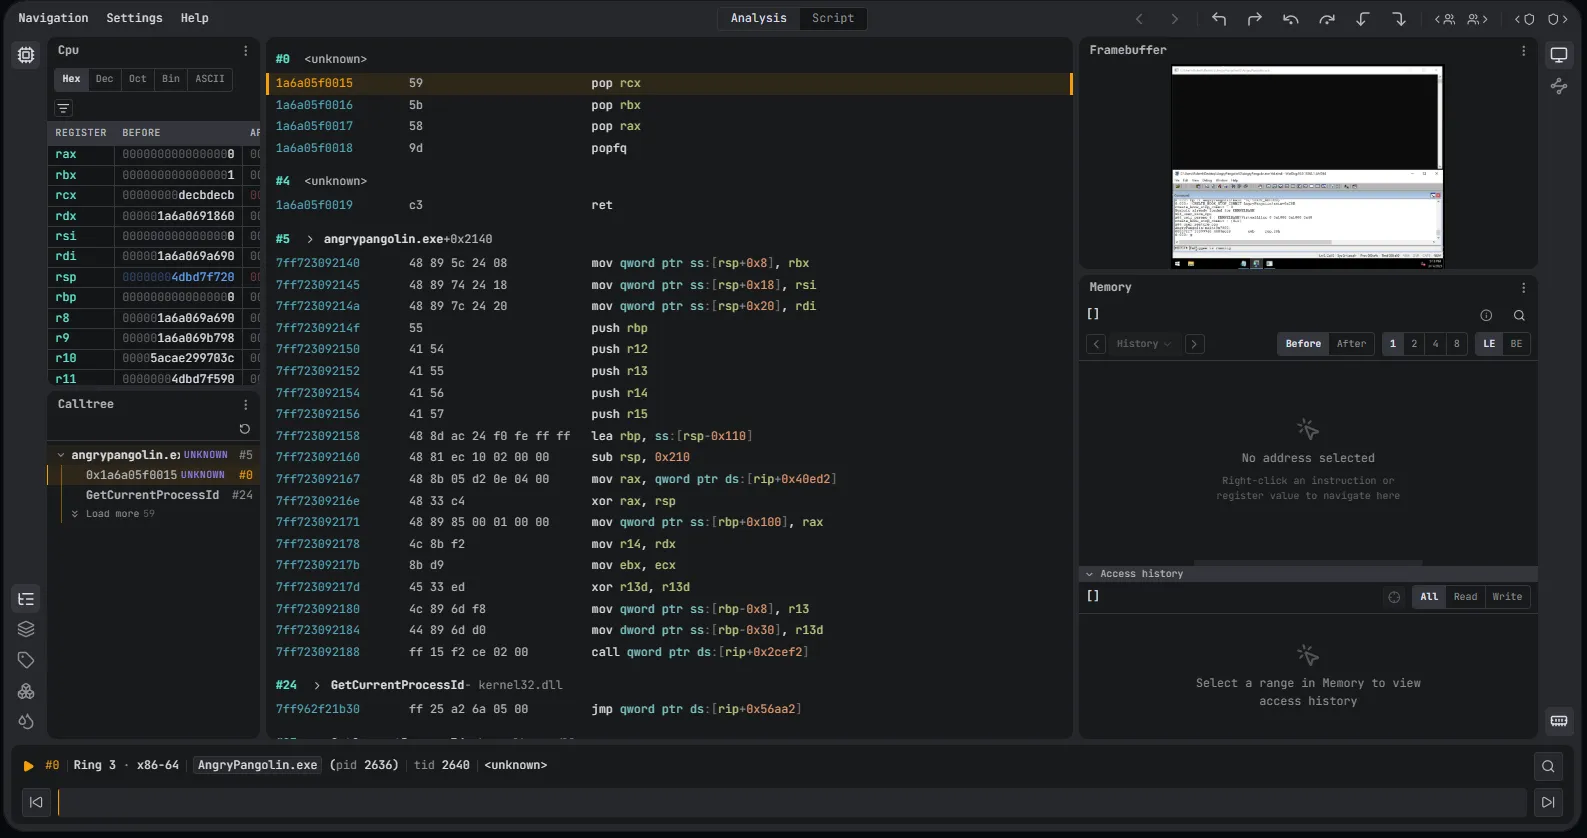
Where traditional debuggers stop, Epoch keeps going.
A traditional debugger shows you one process, one moment at a time, live. Epoch records the whole Windows system, so you can come back to any moment, in any process or in the kernel, as often as you need. Read:the full comparison →
One platform for the whole investigation.
esReverse turns the whole workflow into a shared workspace. Epoch runs there, next to the tools your team already uses, and what you find doesn’t disappear when a session ends.
Static and dynamic, side by side
Open IDA, Ghidra or Binary Ninja in the same project as the trace, and read the code next to what it actually did at runtime.
Work on the same recordings
Every Epoch recording is shared. Tags and comments stay on the exact instruction, so when one analyst finds where the malware decrypts its payload, the next one starts from there.
Build on every case
Recordings and analyses stay in the project after a case is closed, so the next investigation can start from a sample the team has already traced.

For Windows analysts who need to see what really ran.
Malware analysis
Detonate a sample once, then follow it from process to process and into the kernel, without running it again.
Vulnerability research
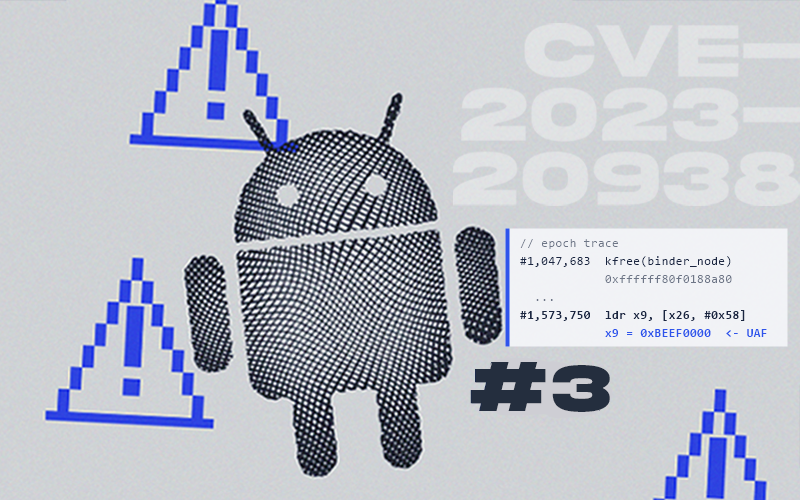
Go back from the crash to the first corrupting write, and follow the attacker’s bytes from the file or packet that brought them in.
Kernel research
Follow an IOCTL from the userland call into the driver, and go back from the bugcheck to the write that caused it.
Incident response
See exactly what a suspicious binary did on the system, and hand over a recording anyone on the case can check.
See it in action.
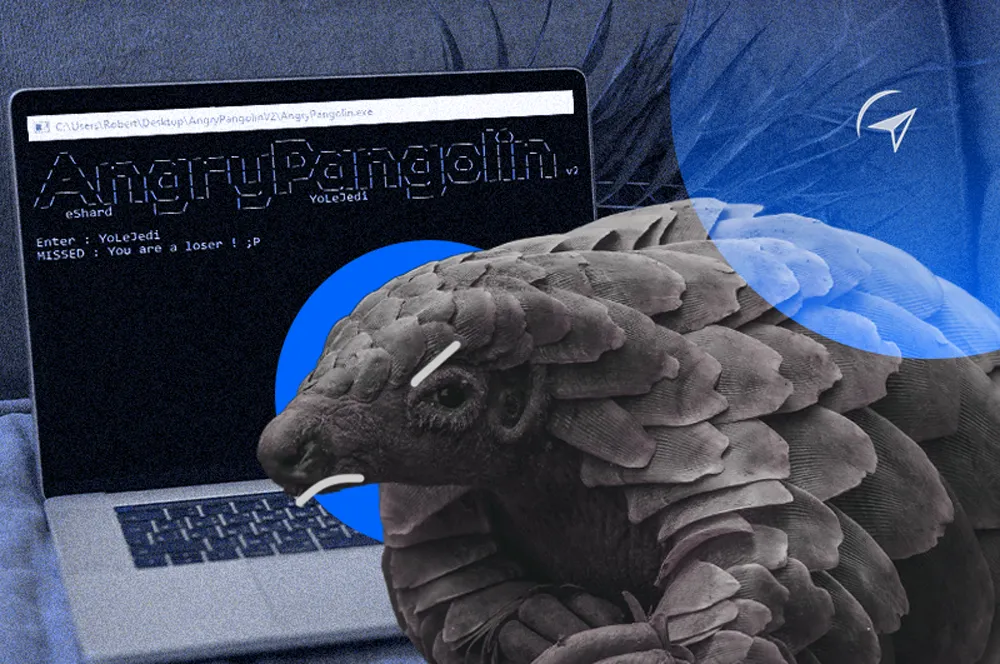
Cracking a Ring3/Ring0 key validator with time travel debugging
A Windows challenge splits its key check between a user-mode program and a kernel driver. With both in one trace, an AI agent followed the data across rings and found the key in 6 minutes.
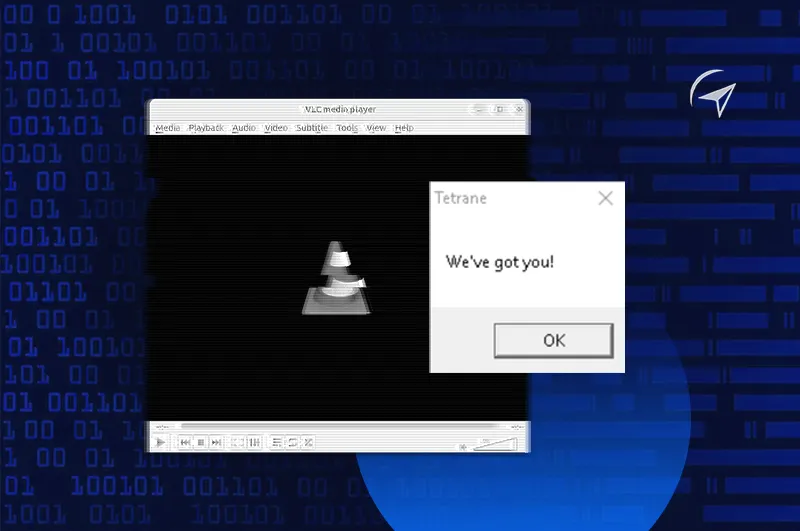
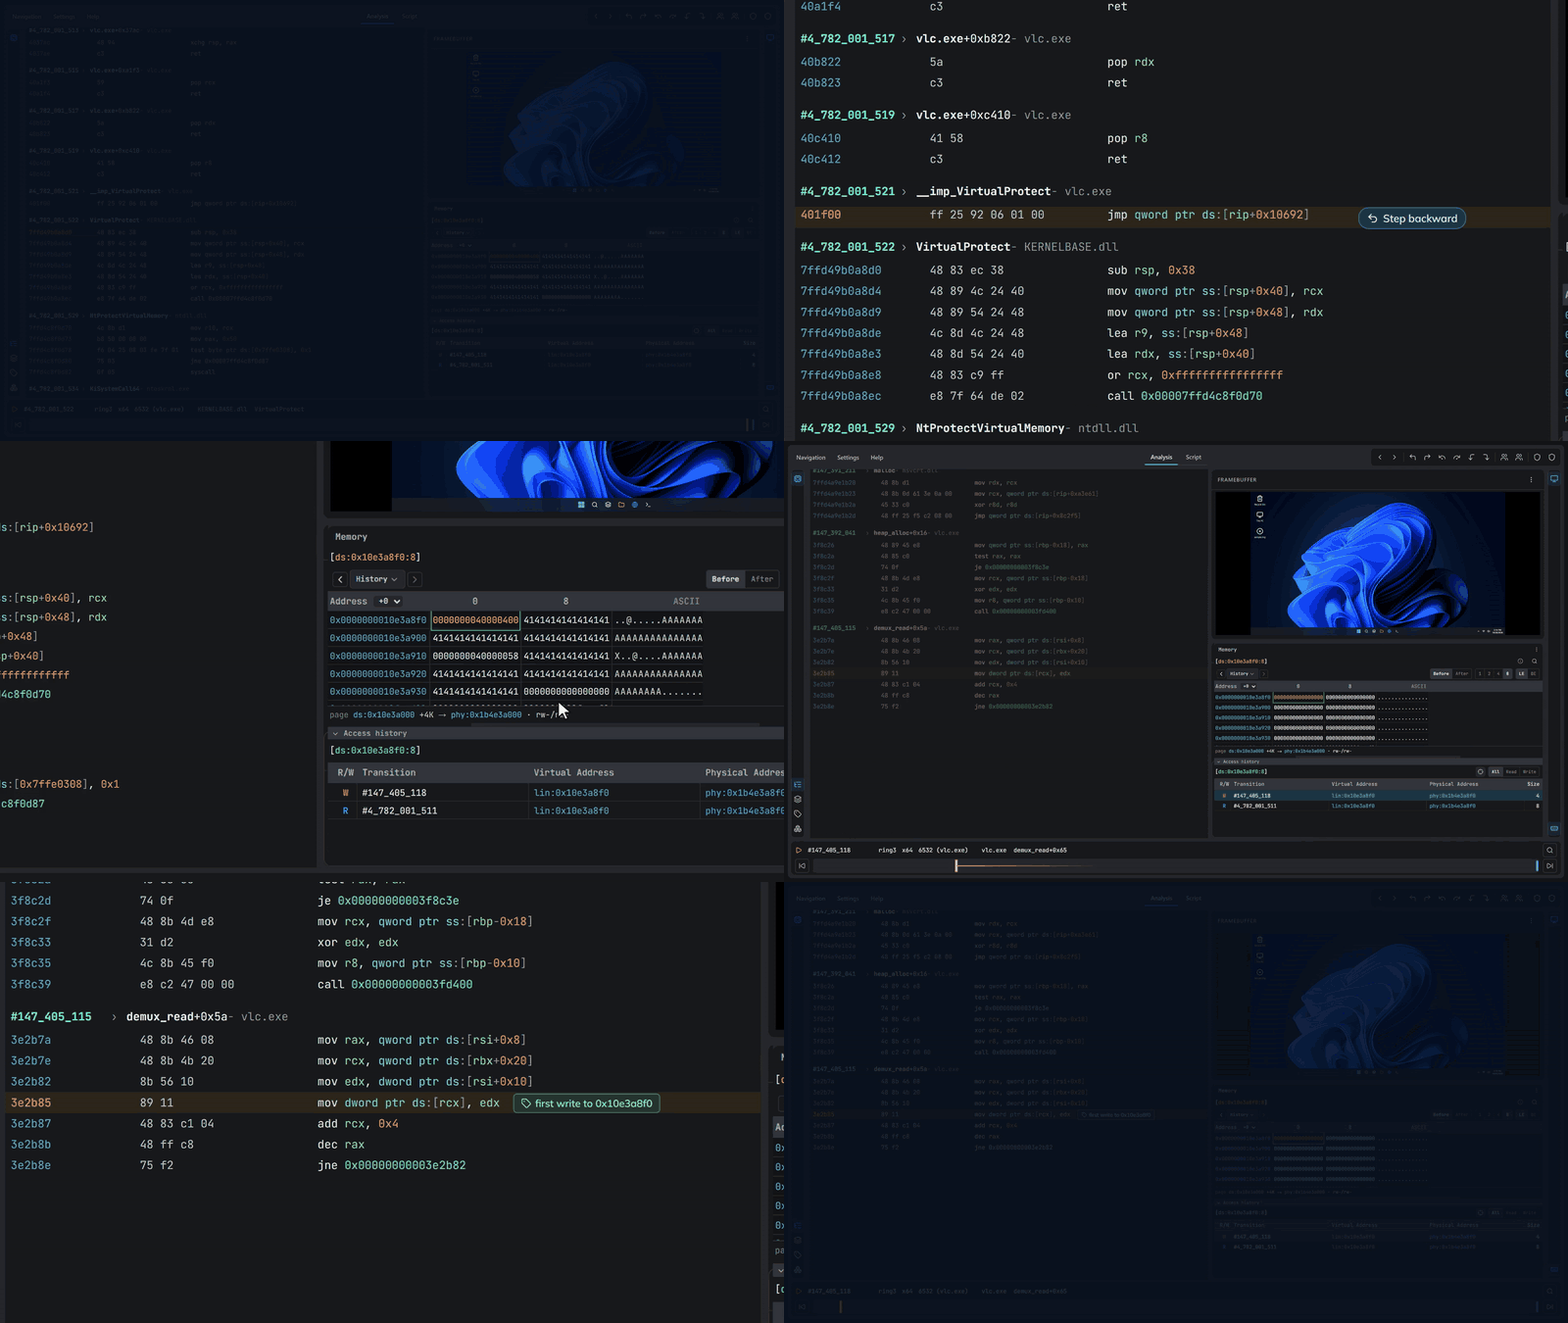
Analysing a VLC exploit on Windows with TTD and an AI agent
From a 4.78-billion-instruction trace, an AI agent rebuilt the whole exploit: a use-after-free in the MKV demuxer, a heap spray, a ROP chain and the shellcode.
Record malware execution in a single prompt with Epoch
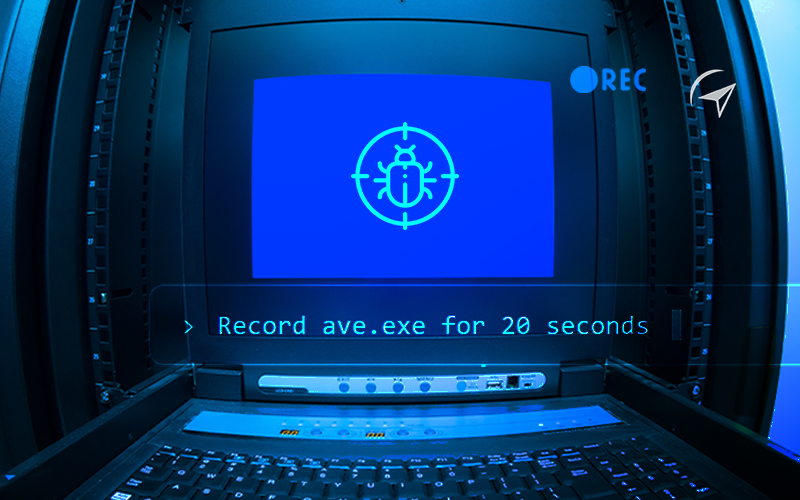
One sentence is enough: the agent isolates the VM, drops the sample, records it from its first instruction and indexes the trace.
Let’s look at your Windows target.
Tell us what you need to investigate: a sample, an exploit, a driver or a crash. We’ll check whether it’s a good fit and walk you through the workflow on a case like yours.
Frequently Asked Questions

WinDbg’s time travel debugging records one user-mode process, and it does that well. Epoch records the whole Windows system, kernel and drivers included, on one timeline, and adds taint analysis, memory history and an AI agent that works on the trace.
Yes. Epoch records the whole system, so the kernel and every driver are in the same trace as userland. Lite VMs have test signing turned on, so your own test-signed drivers load.
Any version of Windows, up to Windows 11. Nothing is pinned to a specific build, so you can record the exact version and update level you need.
No debugger is attached to the sample: Epoch records the VM from the outside, so anti-debugging checks have nothing to find. The sample does run in an emulated machine, and some malware checks for that. Most of those checks can be countered by configuring the VM; a few that target the emulator itself are harder.