
Full-system time travel debugging for Linux
Record a whole Linux VM, Intel or Arm, in one trace: the kernel, every module and every process. Then rewind it with your AI to the root cause of ELF malware, rootkits and kernel bugs, and check every finding at the exact instruction.

Full-system time travel debugging for Linux
Record a whole Linux VM, Intel or Arm, in one trace: the kernel, every module and every process. Then rewind it with your AI to the root cause of ELF malware, rootkits and kernel bugs, and check every finding at the exact instruction.


Where Linux investigations get stuck
The rootkit lies to your tools
An eBPF program or a kernel module hides processes, files and connections, so ps, ls and netstat only show what it allows.
The panic shows the end, not the cause
A vmcore is one moment. The write that corrupted the kernel happened earlier, and the dump can’t take you back to it.
The recorder stops at the kernel
You can rewind a program, but not the kernel or its modules, and the recorder needs CPU counters that many VMs don’t expose.
Epoch records the whole Linux system, kernel included.
The rootkit can’t lie to the trace
Epoch records from outside the VM, so you see the hook and what it hides, instruction by instruction.
Go back from the panic
Every instruction before the crash is in the trace, so you step back to the write that caused it.
The whole machine in one trace
The kernel, its modules and every process on a single timeline.
From a Linux sample to its root cause, in 3 steps.
Start a Linux VM that’s ready to record, on Ubuntu 26.04 or Debian 13. Already have a Linux VM? Import it into Epoch.
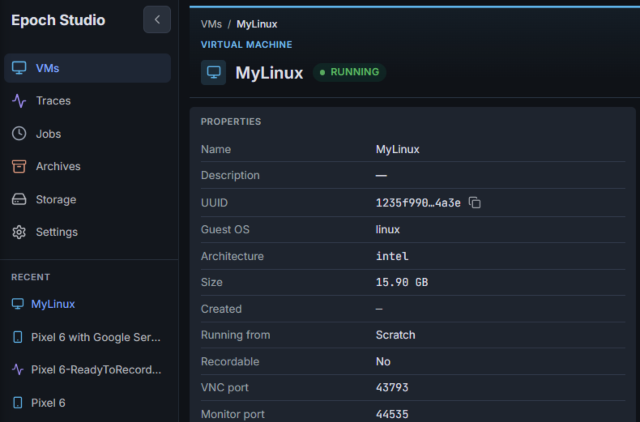
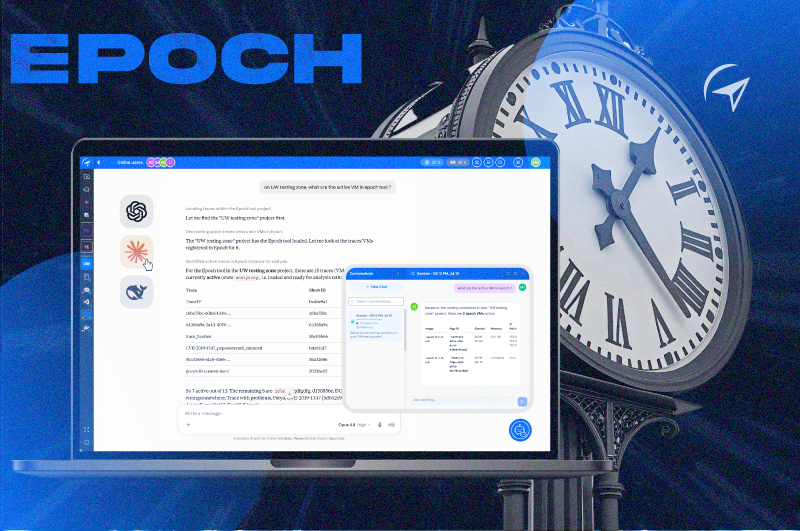
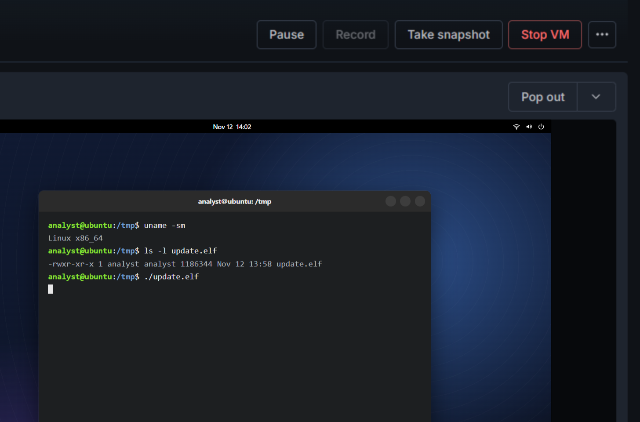
Epoch records the whole VM in one trace, from the kernel to userland: every instruction, register and memory access, across every process and kernel module. Once it’s recorded, you can analyze the run for as long as you need.
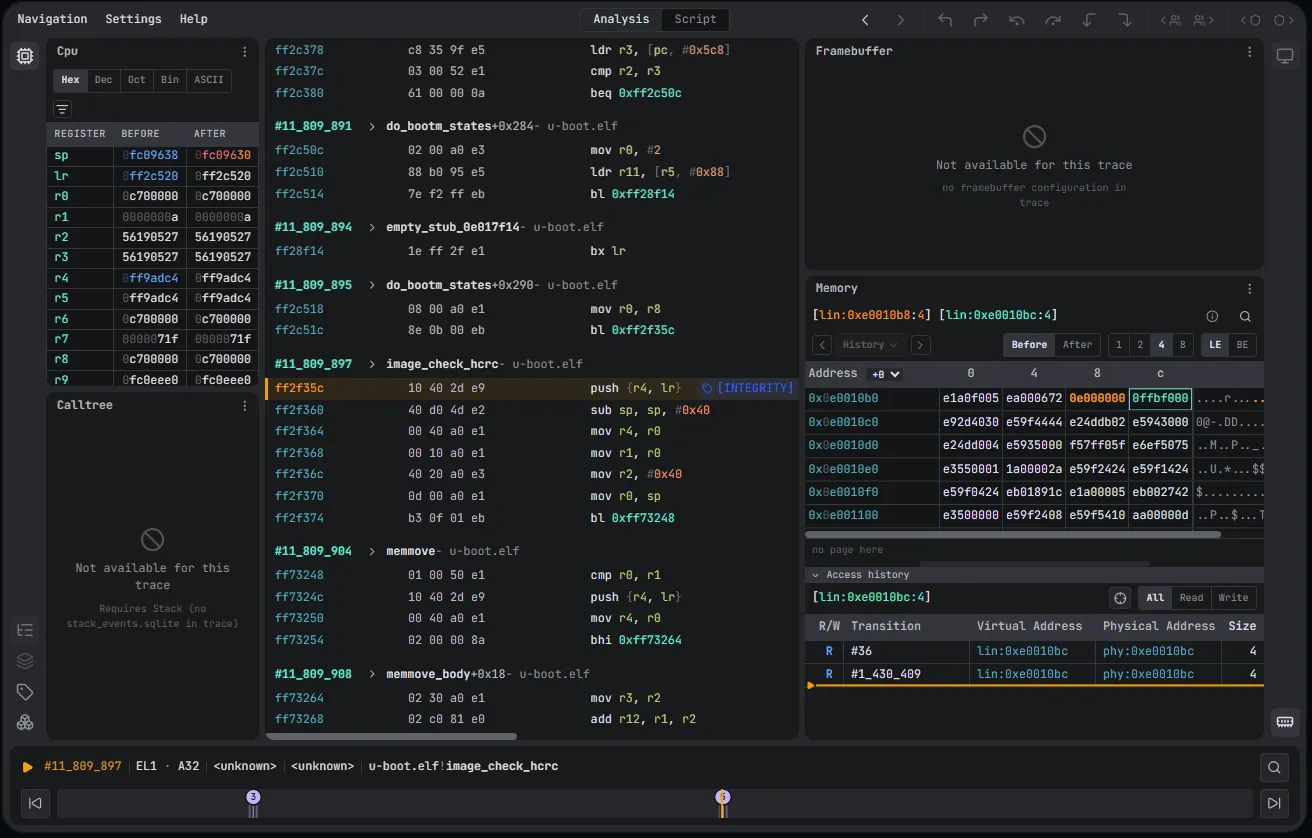
In Epoch, move backwards from the crash to its cause. Follow the call tree, see every read and write to an address, search the whole trace for a string, and tag the moments that matter. Kernel and module functions appear by name.
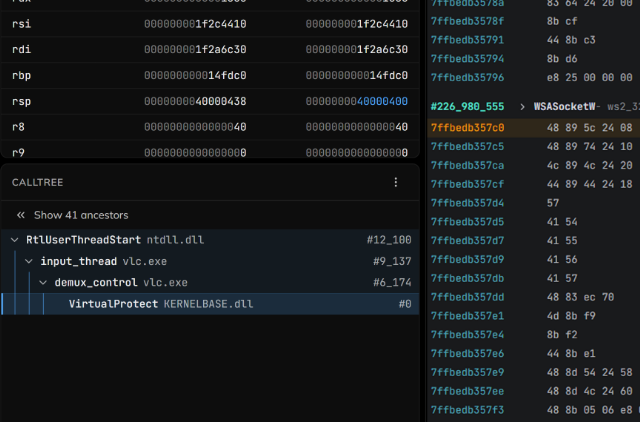
Explore a full Linux kernel recording.
Open Epoch on a full-system recording of CVE-2023-20938, a use-after-free in the Linux kernel’s Binder driver. The free and the stale read are already bookmarked: go backwards and forwards between them yourself.
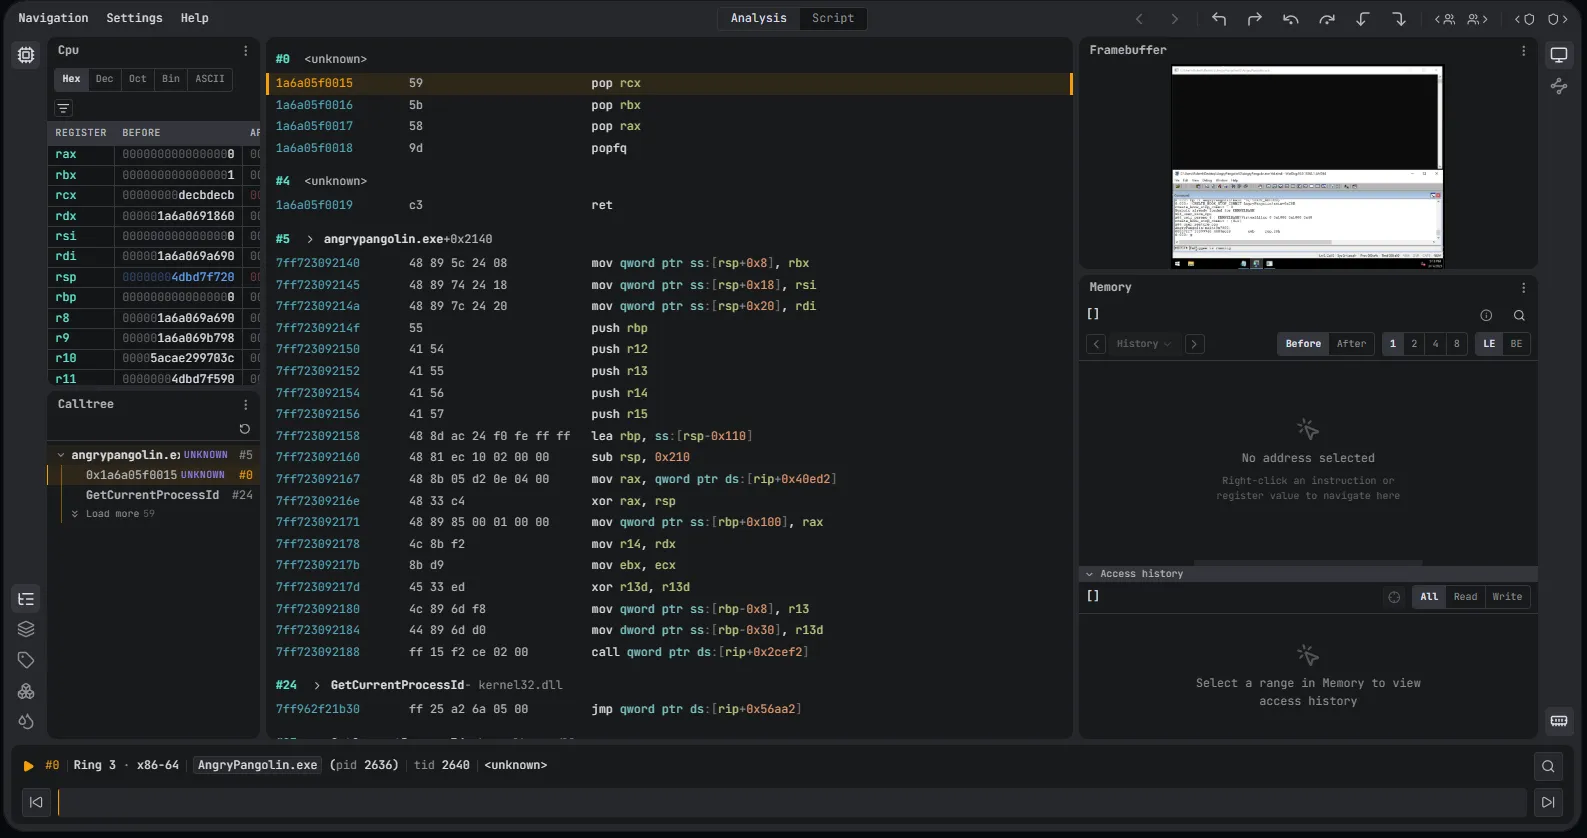
Record Linux on Intel and Arm.
Ubuntu 26.04 LTS
Start an Ubuntu VM from Epoch in one prompt, with a clean snapshot to record from.
Debian 13
The same on Debian: a VM that’s ready to record, for samples and bugs that target Debian systems.
Your own Linux VM
Import the VM you already use, with the exact kernel, modules and packages your case needs.
rr records a process tree. Epoch records the machine.
rr, the open-source record and replay debugger, rewinds the user-space processes it launches. Epoch is full-system record and replay: it keeps going when the investigation reaches the kernel.
One platform for the whole investigation.
esReverse turns the whole workflow into a shared workspace. Epoch runs there, next to the tools your team already uses, and what you find doesn’t disappear when a session ends.
Static and dynamic, side by side
Open IDA, Ghidra or Binary Ninja in the same project as the trace, and read the code next to what it actually did at runtime.
Work on the same recordings
Every Epoch recording is shared with the project's members. Tags and comments stay on the exact instruction, so when one analyst finds where the malware decrypts its payload, the next one starts from there.
Build on every case
Recordings and analyses stay in the project after a case is closed, so the next investigation can start from a sample the team has already traced.

Built for Linux malware, rootkit and kernel investigations.
Malware analysis
Go past the sandbox report: record an ELF sample once, a botnet or a miner, then follow it from process to process and into the kernel.
Vulnerability research
Go back from a kernel crash to the first corrupting write, and hand over a recording of the bug that anyone can check.
Kernel research
Follow a syscall or an ioctl from userland into the kernel module, and go back from the kernel panic to the write that caused it.
Rootkit analysis
Watch an eBPF program or a kernel module load, hook and hide, instruction by instruction, even when the live system lies to you.
See it in action.
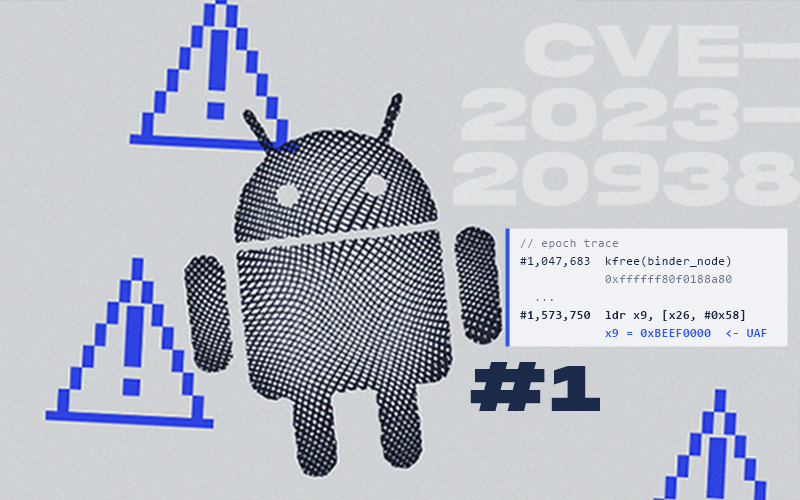
Kernel UaF to Root #1: Freeing an Object That’s Still in Use
CVE-2023-20938 in the Binder driver, recorded once: the free and the stale read sit in the same trace, so nothing is lost when the kernel crashes.
Copy.fail: Why Internal LLMs Are Non-Negotiable for Security
The Copy.fail exploit broken down with a model that runs on premises, so the sample and the analysis never leave your network.

Reversing DirtyC0W
The classic Linux kernel race condition, reverse engineered from a full-system recording.
Let’s look at your Linux target.
Tell us what you need to investigate and we’ll walk you through the workflow on a case like yours.
Frequently Asked Questions

Yes. Epoch records the kernel with every process, so you can step backwards through kernel code, from a panic back to the write that caused it.
rr records the user-space processes it launches, from inside the system. Epoch records the whole Linux VM from outside, so the kernel, its modules and every process are in the same trace.
Ubuntu 26.04 and Debian 13, on Intel and Arm. Already have your own Linux VM? Import it into Epoch and record the exact kernel and packages you need.
Any AI assistant you already use. The agent answers from the recording, so every finding points to the exact instruction where it happened, and you can check it in Epoch.