Fernanda Delestre
|
0
|
July 31, 2024



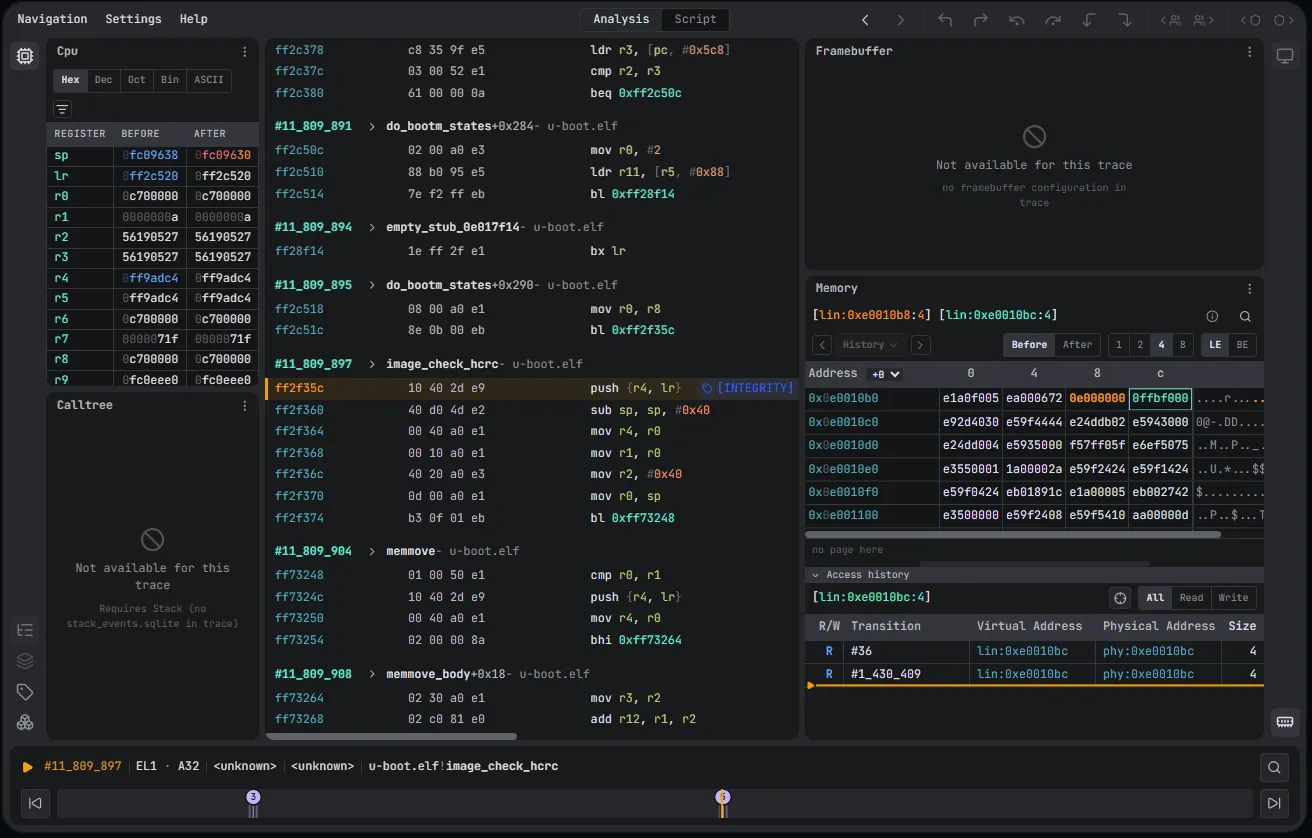
Taint analysis answers two questions about a piece of data in a program: where does it go, and where did it come from? You mark some data as tainted, usually because it comes from outside the program (a file, a network packet, a key typed by a user), and the analysis follows it through every instruction that copies, combines or tests it. Anything the tainted data reaches becomes tainted in turn.
Security teams use it to check whether untrusted input reaches something sensitive, such as a length field, a pointer, a branch or a system call, and to explain a crash by walking back from the bad value to the input bytes behind it. Malware analysts use it the same way on a decryption key or on a command received from a server.
It comes in two forms. Static taint analysis reasons over code without running it, so it has to treat every path as possible. Dynamic taint analysis follows one real execution. When that execution has been recorded as a full trace, as it is with time travel debugging, you can run the analysis as often as you like, in both directions, on exactly what happened.
This post shows how taint analysis works in Epoch, step by step.
Forward taint starts at a source and asks where the value goes. You pick the bytes a ReadFile call wrote, or the eight characters of a license key, and Epoch marks every register, memory location and flag they influence from that point to the end of the trace.
Backward taint starts at a point of interest and asks where it came from. You pick the pointer that caused a crash, or the comparison that decides whether a key is accepted, and Epoch walks back through the trace to the data that produced it.
Both run on the same recording, and most investigations use both. Take a buffer overflow that crashes on a write through a corrupted pointer. Backward taint from that pointer leads to the input that overflowed, which tells you which bytes an attacker controls. Forward taint from those bytes then shows everywhere else they reach, which tells you whether the same input could do more than crash the program.
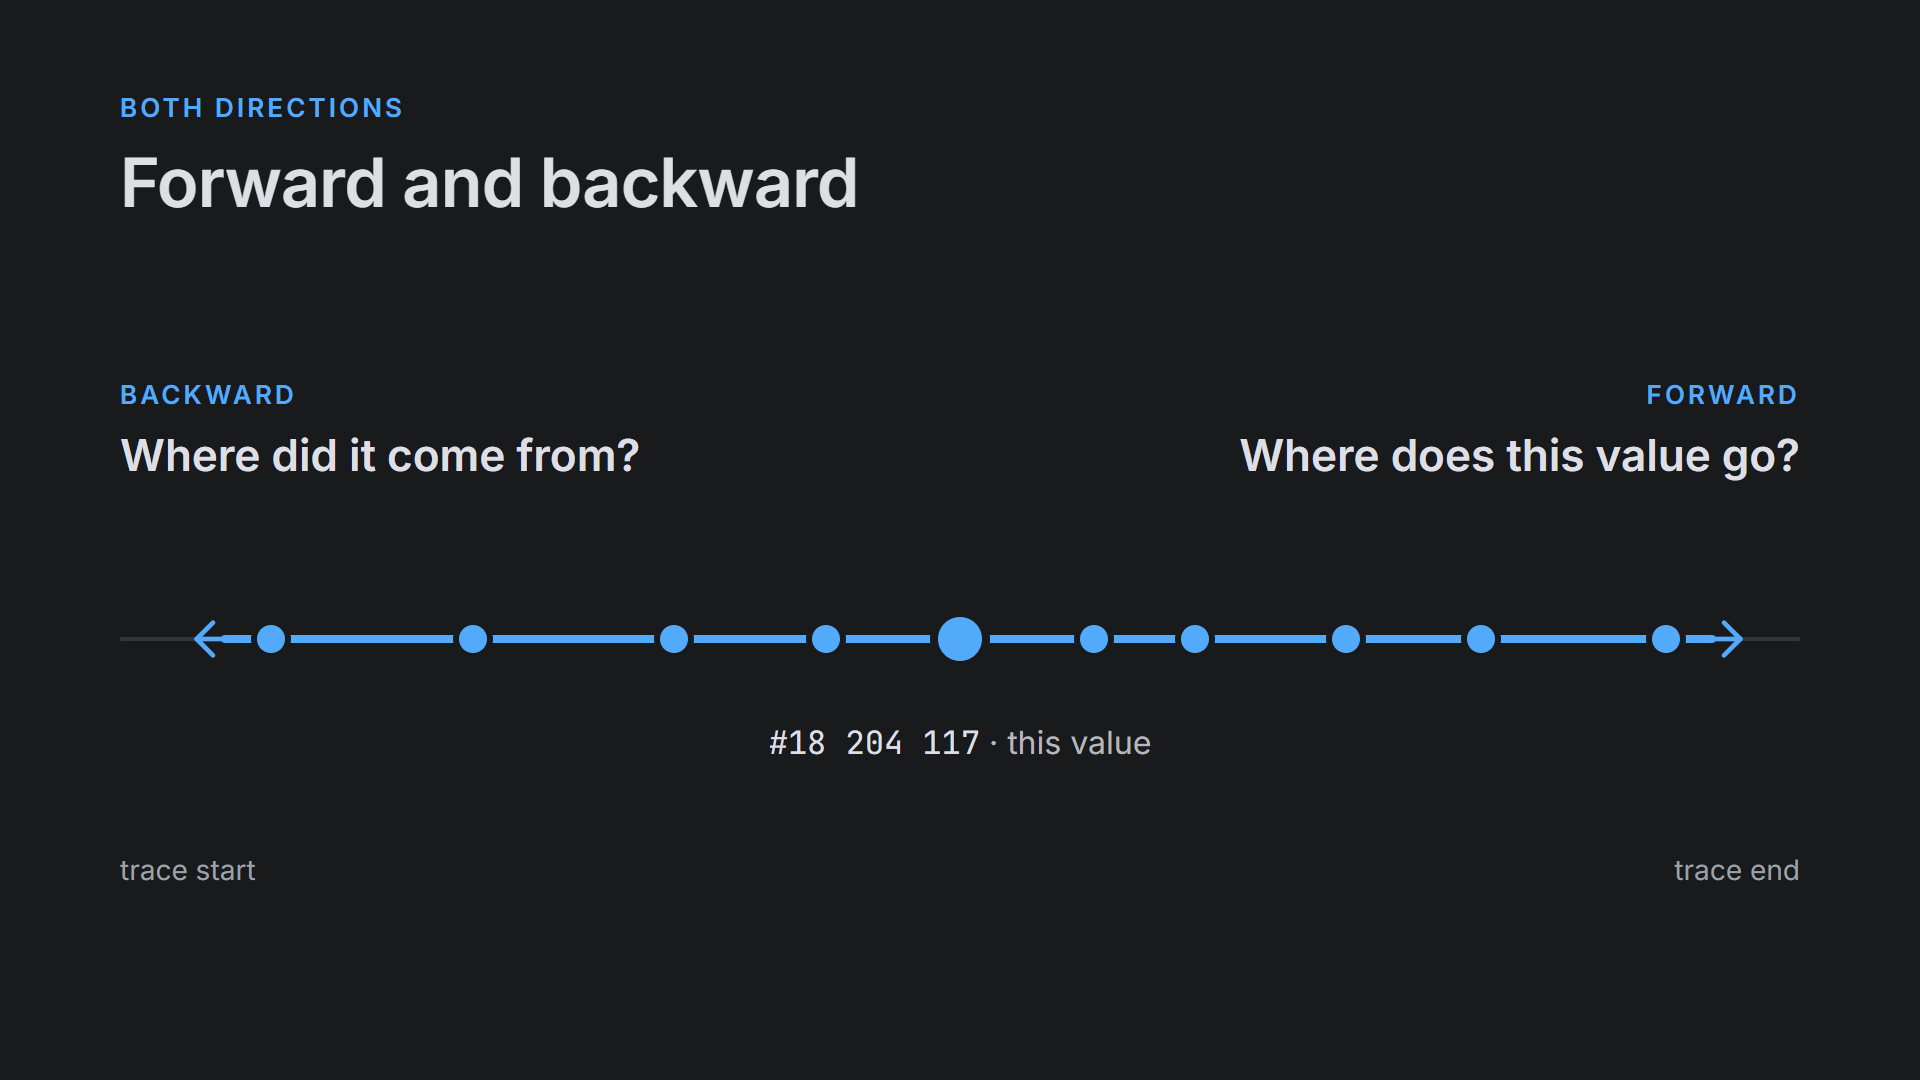
Epoch tracks taint at the level of single bits, and it uses the concrete values recorded in the trace. The example below starts with eight bytes that ReadFile wrote into a buffer. A mov loads them into rax, so all of rax is tainted.
The next instruction is and eax, ecx. Without values, an analysis has to assume the whole of eax still depends on the input. Epoch knows that ecx held 0x0ff0 at that moment, so only bits 4 to 11 of the input can still reach the result. The other bits are now constant zeros, and their taint is dropped.
When rax is stored to [rdi+8], the tainted memory is exactly those 8 bits, spread across 2 bytes. Then cmp eax, 0 sets the zero flag from tainted bits, so the jz that follows is a branch decided by the input. This precision is what keeps results usable: when an engine over-taints, everything ends up marked and the answer tells you nothing.
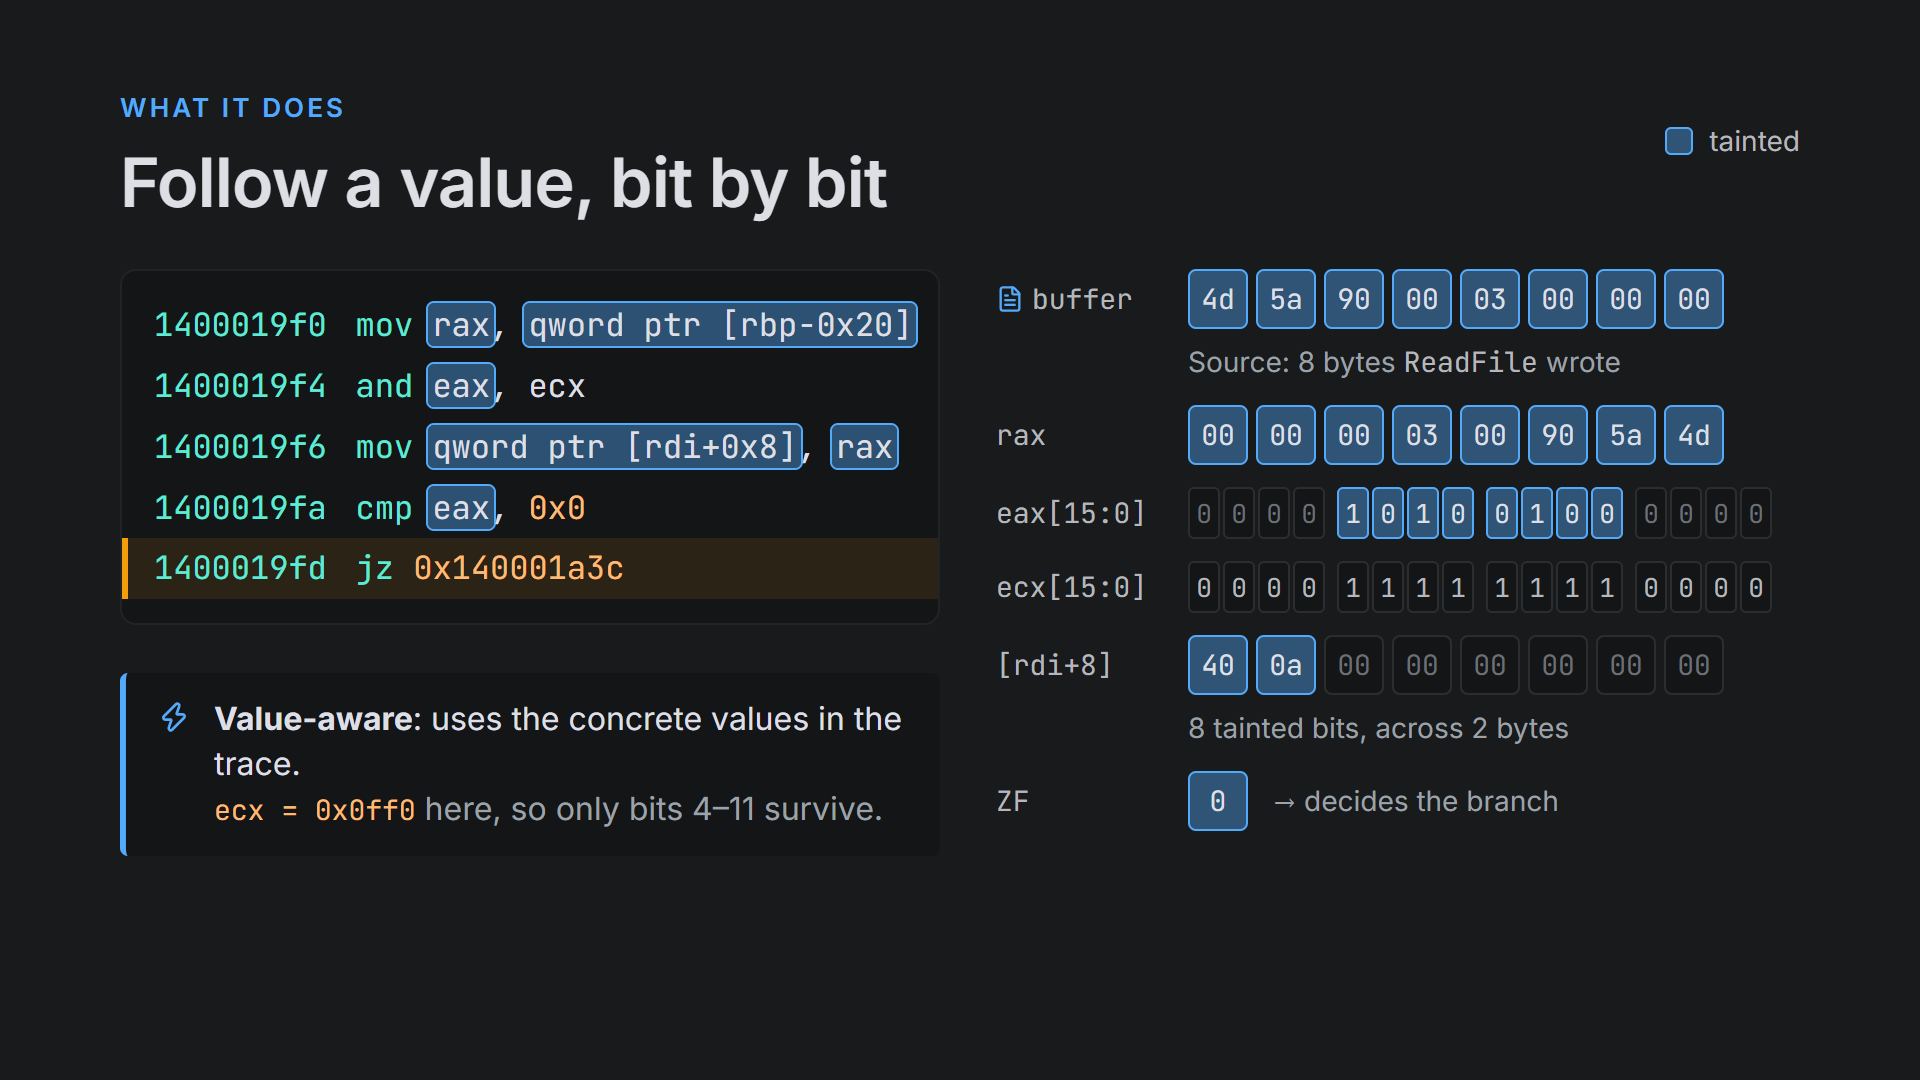
Each time a location gains or loses taint, Epoch records why. A mov from tainted memory taints its destination because of the instruction's semantics. Taint is lost when a register is overwritten by a constant, when a clearing idiom such as xor eax, eax runs, or when a value masks bits out, as the and above did.
Some instructions can't be modeled exactly. When Epoch reaches one, it doesn't guess: it records a barrier with the transition and the reason, and reports it. Taint is never gained or lost silently, so when a result looks surprising you can go to the exact instruction where it changed and read why.
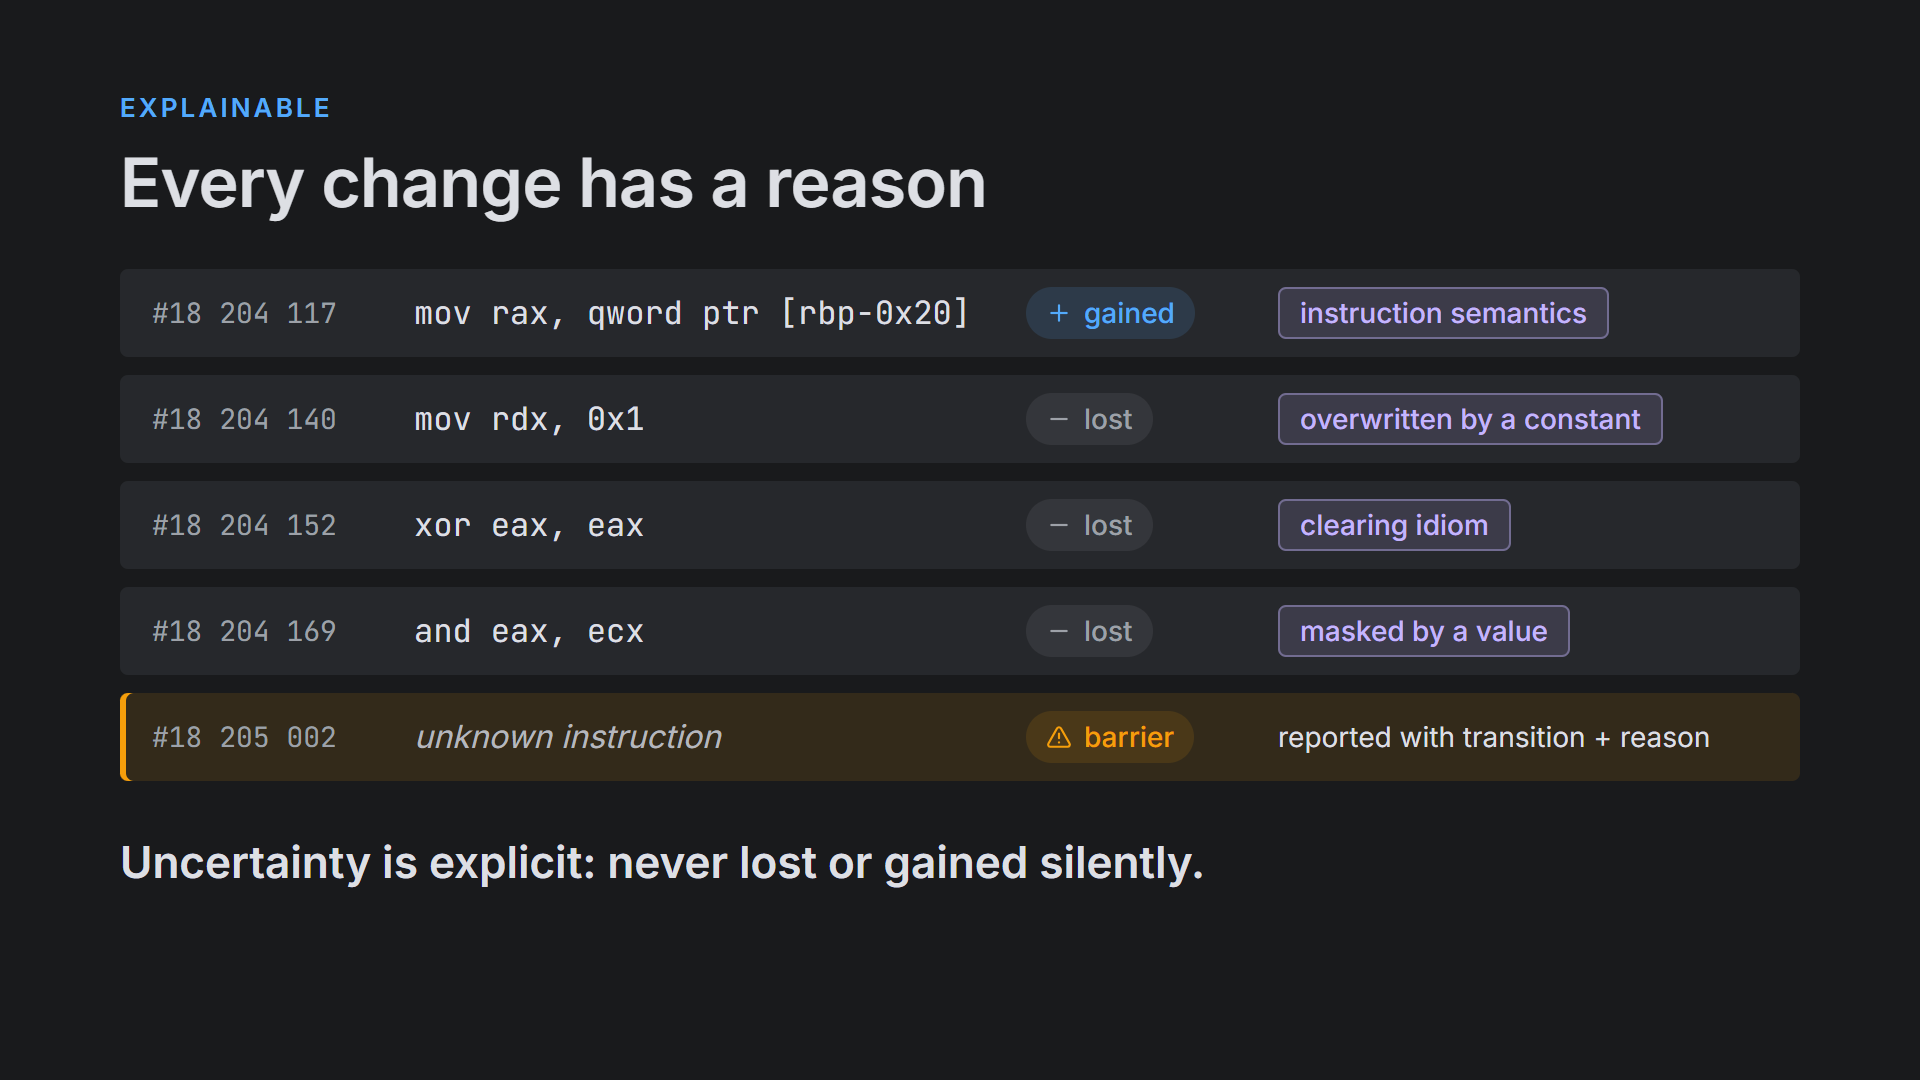
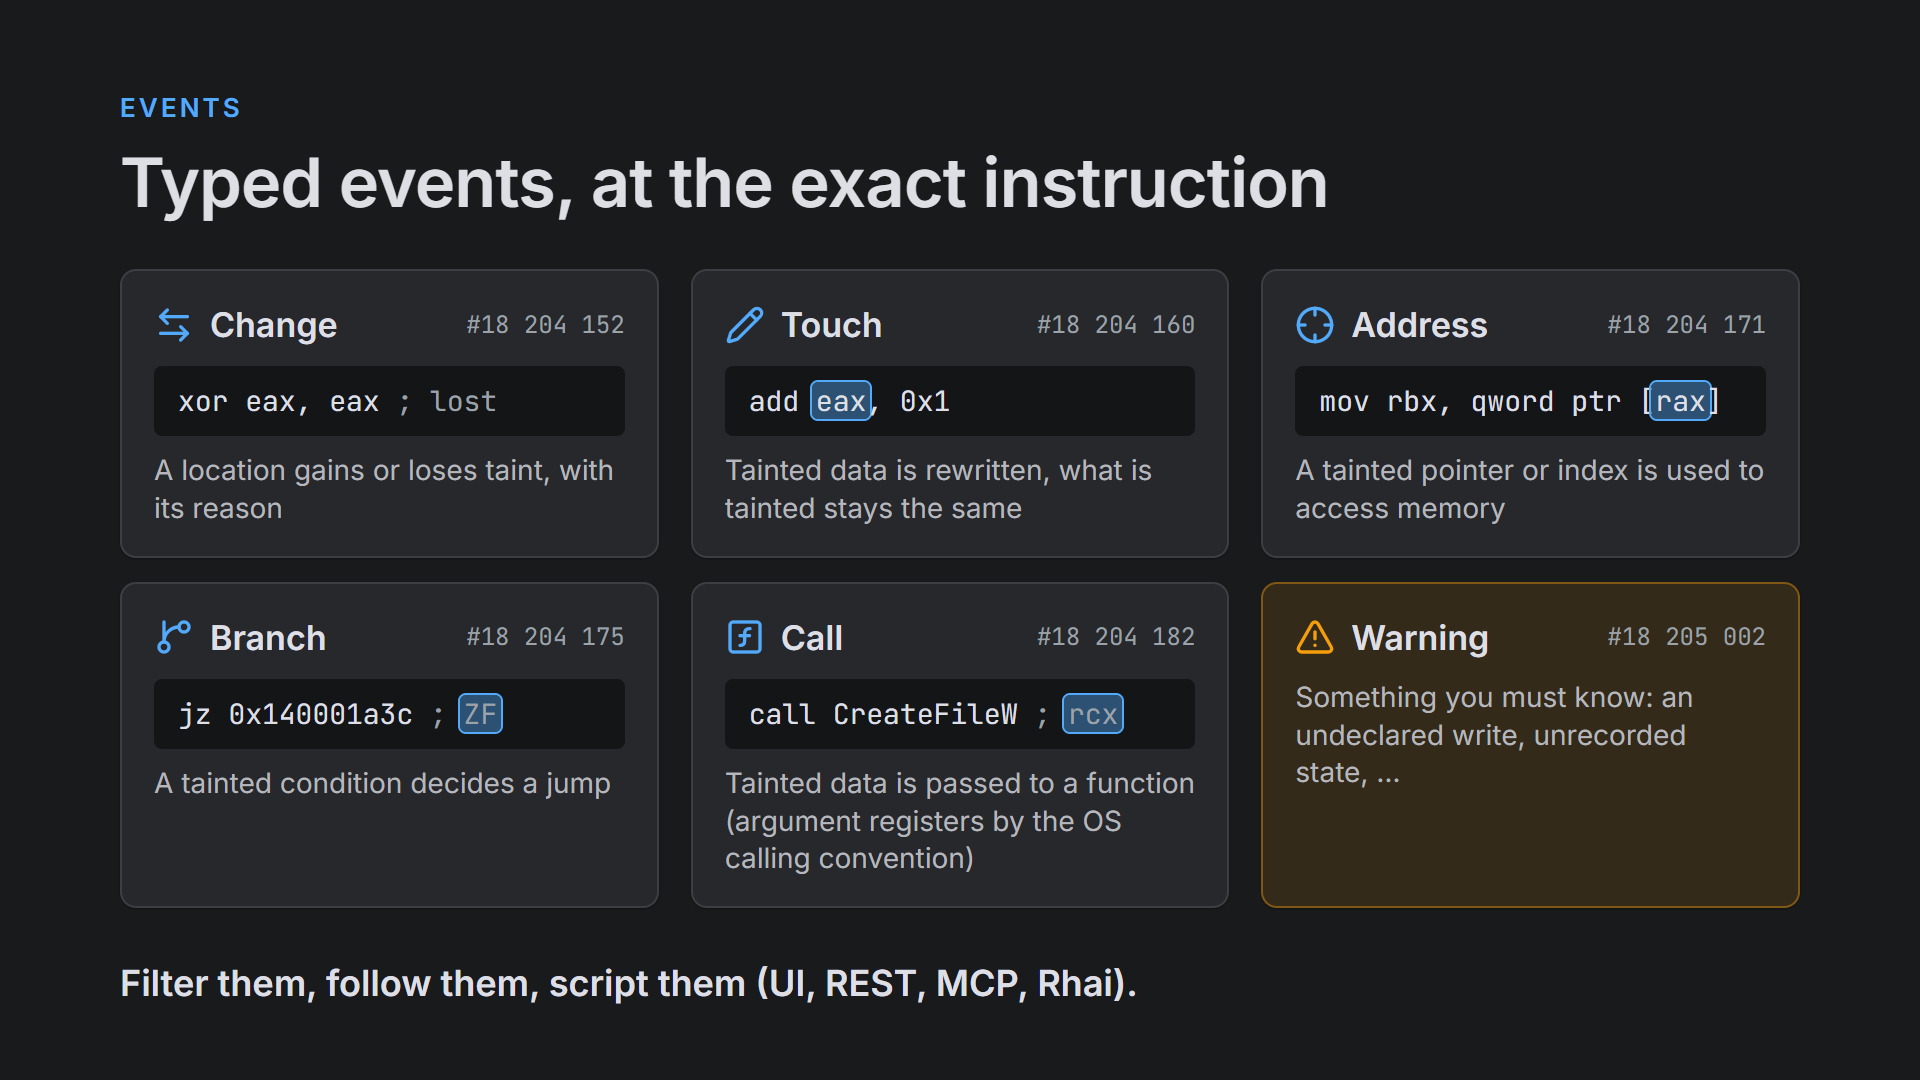
The output of a taint run is a list of typed events, each tied to one instruction in the trace. A change event says a location gained or lost taint, with its reason. A touch event means tainted data was rewritten, by add eax, 1 for example, while the set of tainted bits stayed the same. An address event fires when a tainted pointer or index is used to access memory, the pattern behind many out-of-bounds reads and writes. A branch event marks a jump decided by a tainted condition. A call event shows tainted data passed to a function, with arguments read from registers according to the OS calling convention, so you can see the moment input reaches CreateFileW or any other API. Warnings flag what you need to know, such as an undeclared write or state that wasn't recorded.
You can filter these events, jump to any of them in the trace and script against them.
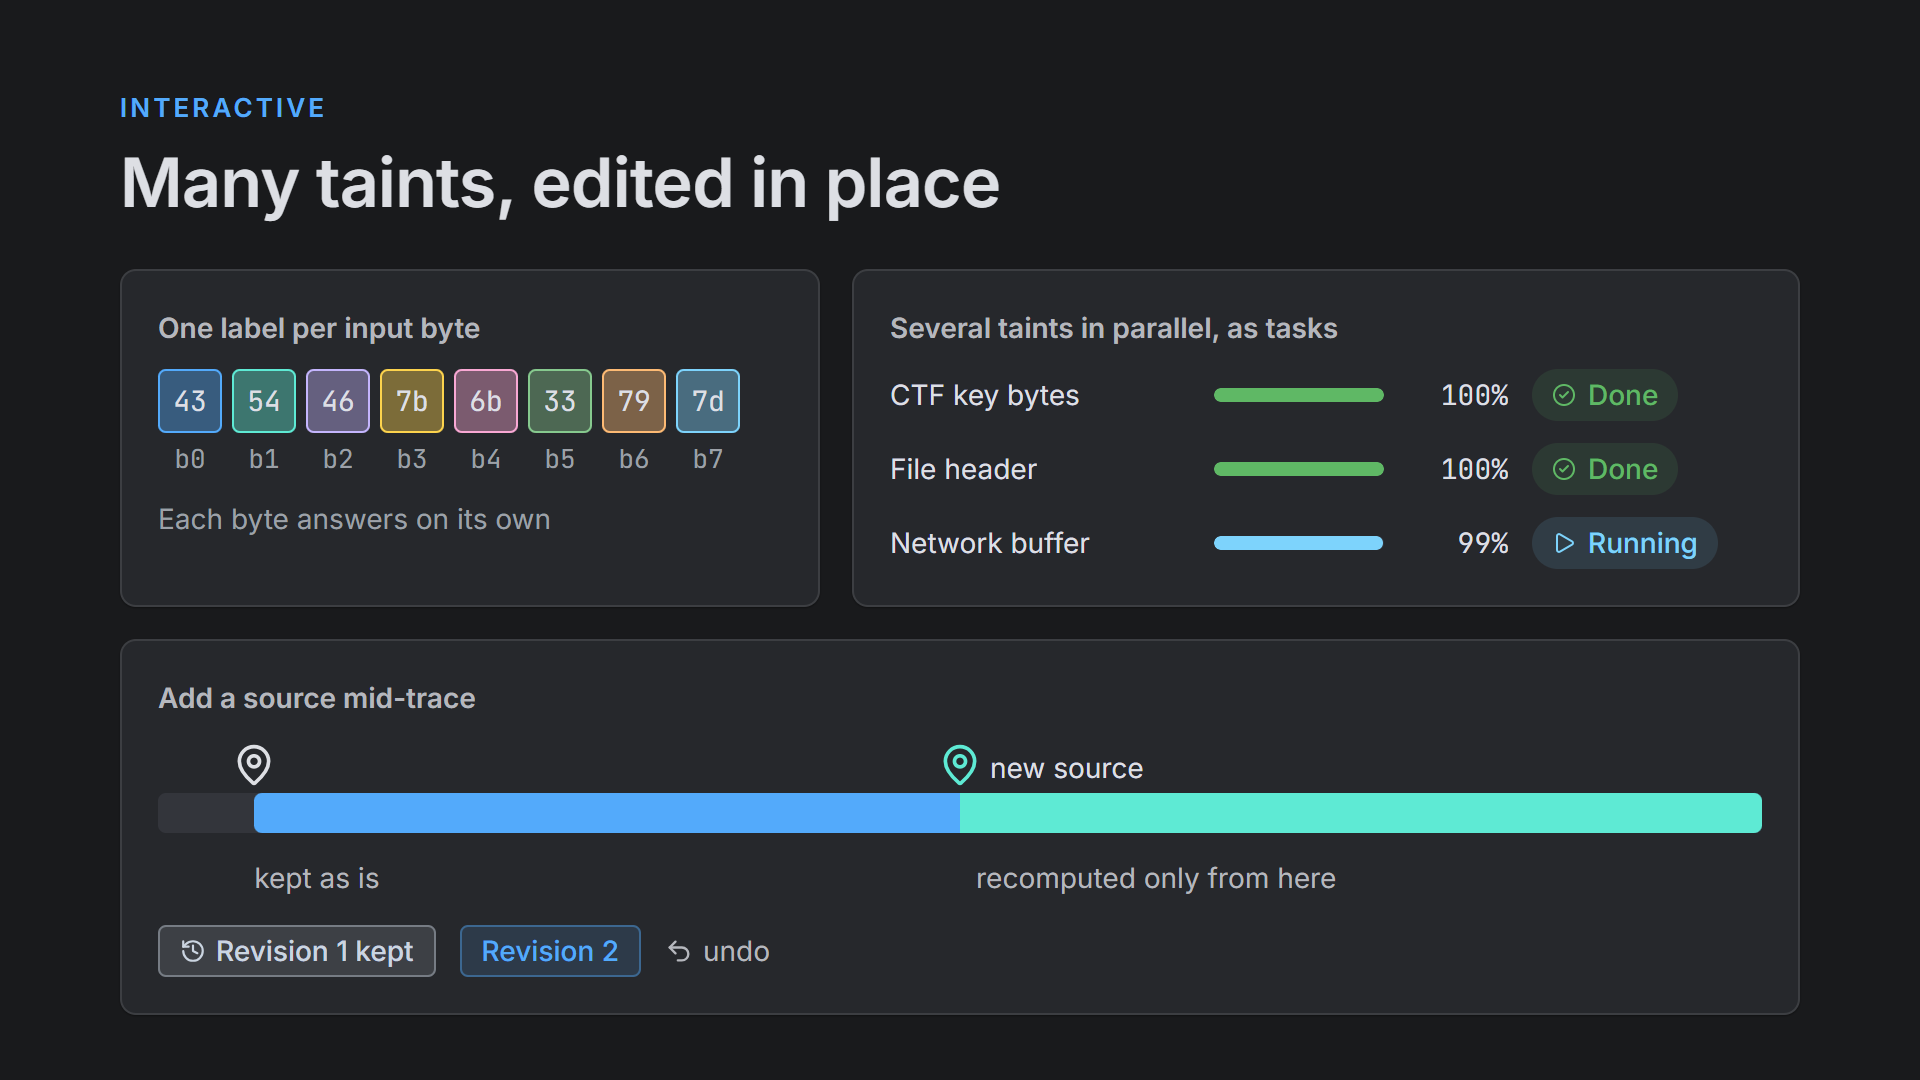
Real investigations rarely have a single source. Epoch can give each input byte its own label, so for an eight-character key you can see which result depends on which character. Several taints can run in parallel as tasks, for instance the key bytes, a file header and a network buffer, and each can be paused and resumed.
You can also add a source in the middle of a trace. Epoch keeps the result up to that point as it is and recomputes only from the new source onward. The previous result stays available as a revision, so the change can be undone.
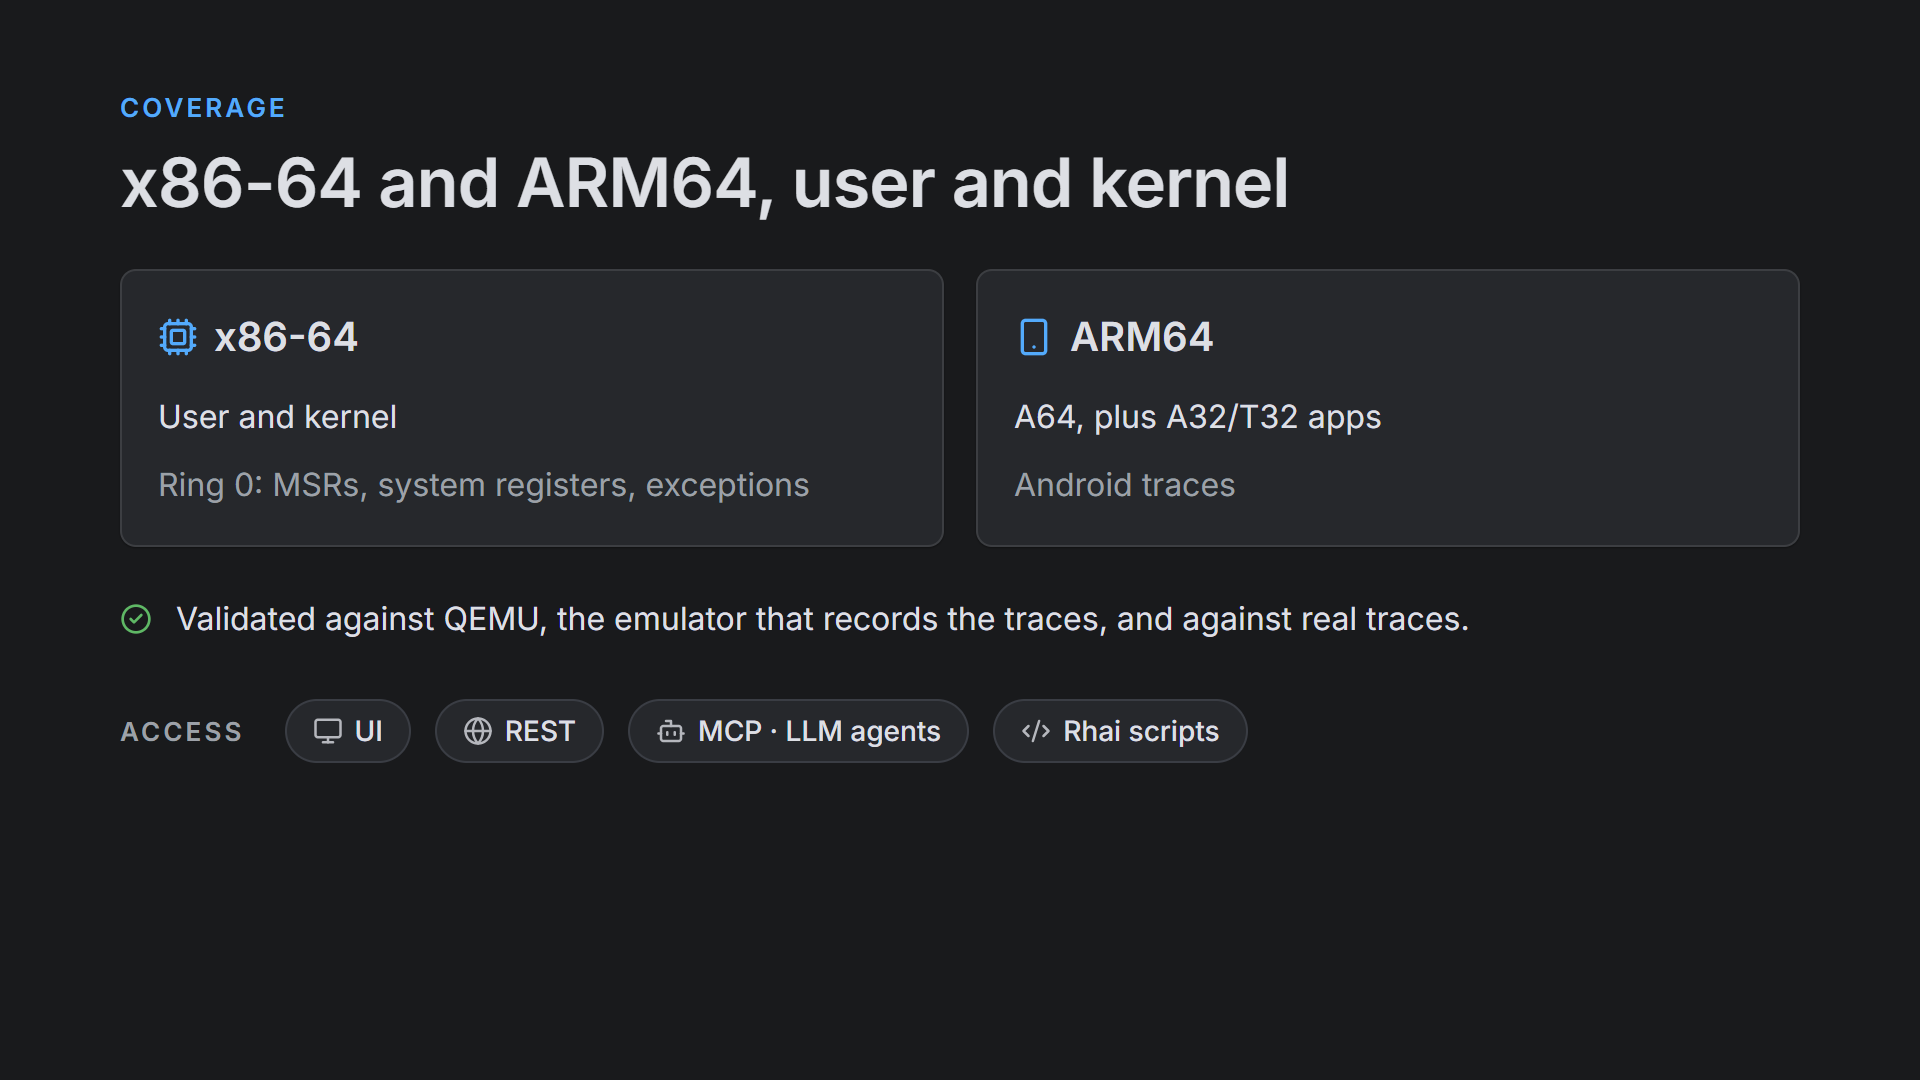
The taint engine covers x86-64 and ARM64 traces. On x86-64 it follows data through user and kernel code, including ring 0 state such as MSRs, system registers and exceptions. On ARM64 it handles A64 code as well as A32/T32 apps, which matters for Android traces. It has been validated against QEMU, the emulator that records the traces, and against real traces.
You can run it from the Epoch interface, a REST API or Rhai scripts, or through MCP, which lets an AI agent query taint on a trace the same way an analyst would. That is how an agent cracked the AngryPangolin key validator from a single prompt, tracing backward from the decision point and forward from the input.
When a taint takes a fraction of a second, you can try a source, look at what it reaches and try another without losing your train of thought. On AngryPangolin, a Windows CTF whose key check is split between a user-mode program and a kernel driver, forward taint of the key over 55 million instructions takes 0.13 seconds in Epoch. Forward taint through a rep movsq buffer copy of 100,000 instructions takes 0.41 seconds.
The AngryPangolin trace is available for free at ttd.eshard.com, along with other recorded challenges.

