Tiana Razafindralambo
|
0
|
April 28, 2026


TL;DR: AngryPangolin v2 is a CTF key-validation challenge that splits its transformation logic between a user-mode application and a custom Windows kernel driver, synchronized through a shared memory page. The 10-step cipher chain interleaves operations across two binaries in two privilege rings, with the shared accumulator mapped at different virtual addresses in each, and the driver itself is XOR-encrypted and embedded in the user binary’s resources. We tested our new MCP-based time-travel debugging tool on this challenge. Claude found the flag in 6 minutes from a single generic prompt: “Solve this CTF challenge.” No additional instructions, no manual guidance. The trace is a complete, indexed, queryable record: we gave eyes to the MCP tool to see screen output at any moment, translated virtual addresses to physical in a single query, traced backward from the decision point and forward from the input, and recovered the correct key. The agent follows the data.
⚠ Spoiler warning: This writeup reveals the complete solution. If you want to solve the challenge yourself, it is available at https://ttd.eshard.com. Stop reading here.
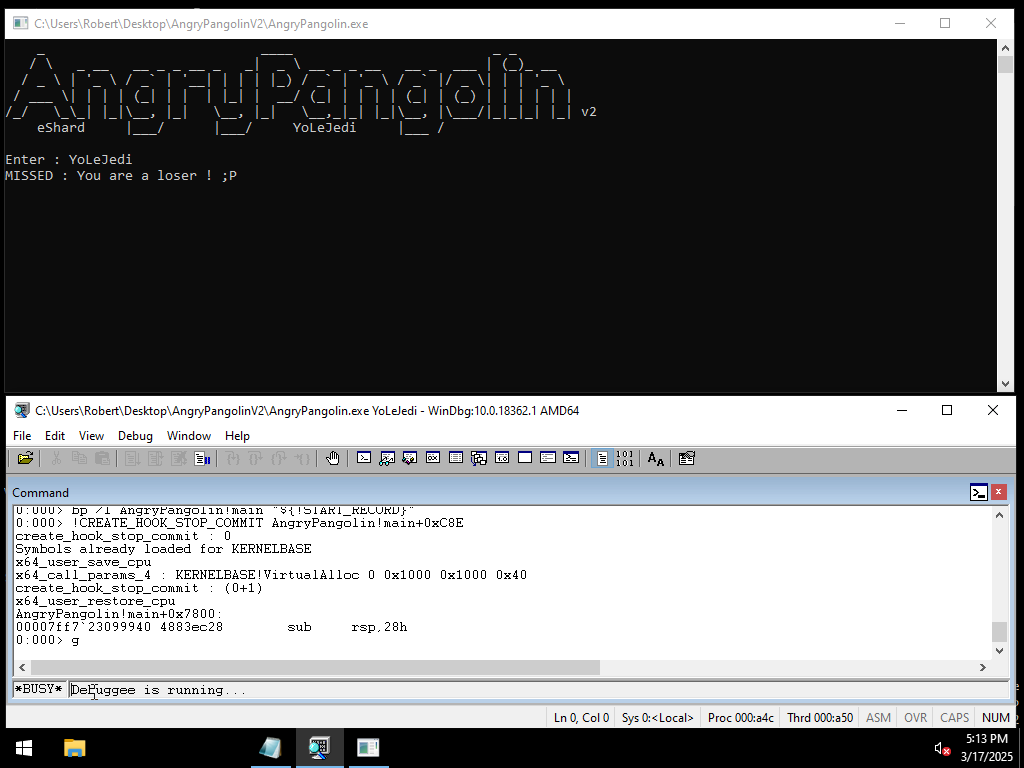
AngryPangolin v2 is a Windows reverse-engineering CTF challenge built around a deceptively simple premise: enter an 8-character key, and the program tells you if you are a “champion” or a “loser.”
Underneath that surface lies a two-layer validation architecture that spans the user/kernel boundary.
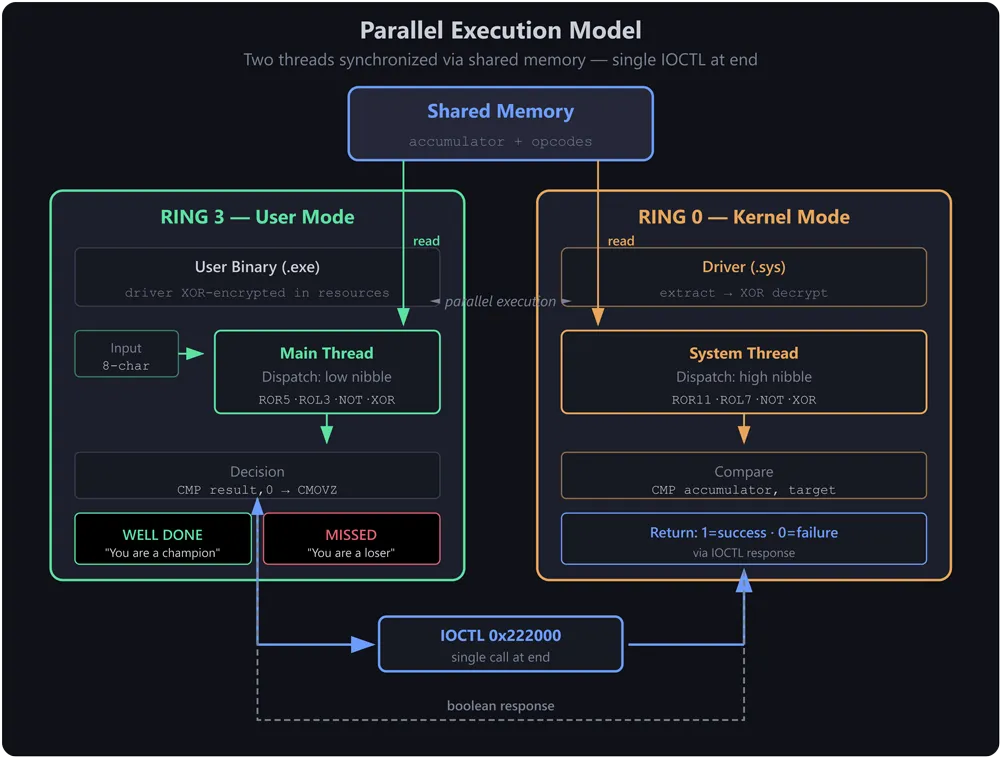
The program accepts an 8-character string and transforms it through a 10-step chain of bitwise operations. The twist: the transformation logic is split across two execution contexts that run in parallel.
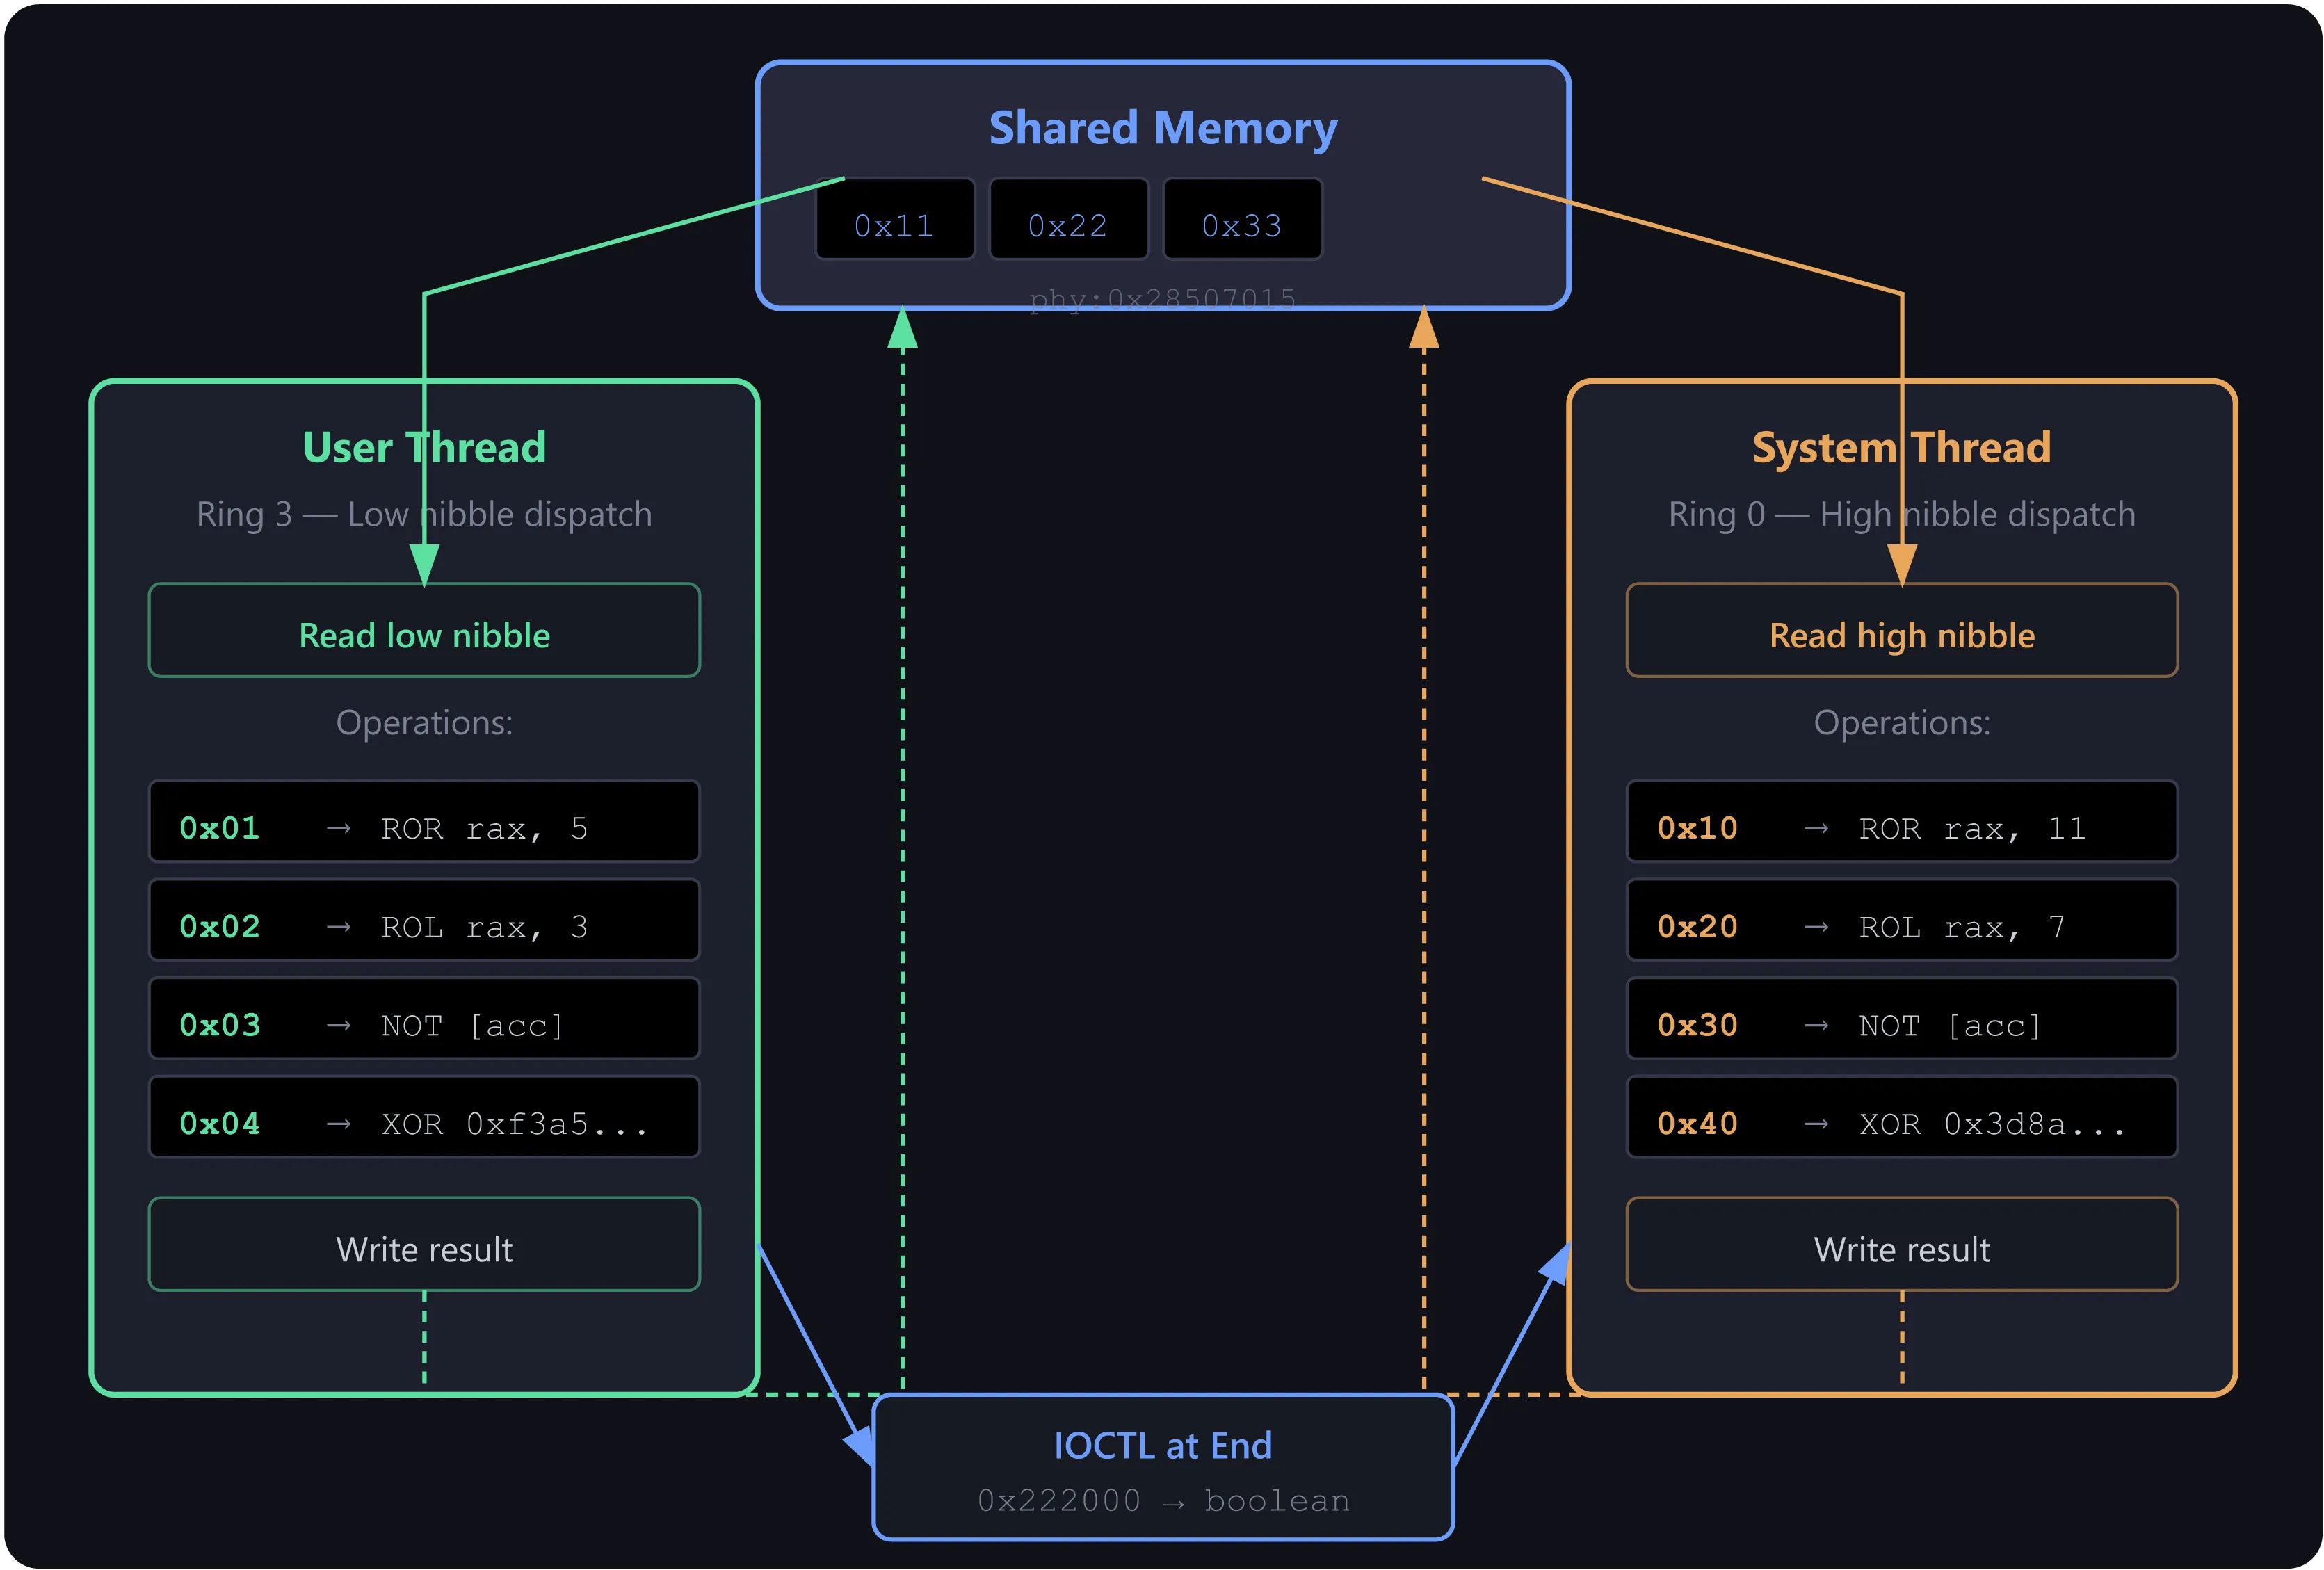
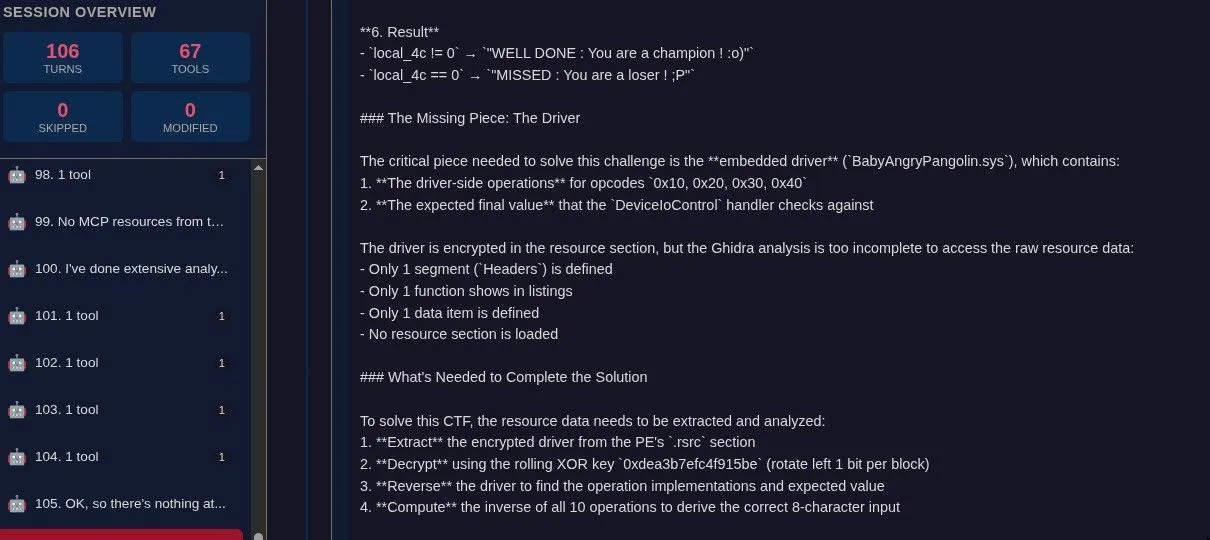
The user-mode application runs a dispatch loop that performs operations based on the low nibble of opcode bytes. Simultaneously, a kernel system thread created by the driver performs operations based on the high nibble of the same opcode bytes. Both threads read and write to a shared memory page, synchronized through these opcode bytes. After all transformations complete, a single IOCTL call (code 0x222000) asks the driver whether the final 8-byte value matches its hardcoded target. The driver returns 1 for success or 0 for failure, and the user-mode program displays either "WELL DONE : You are a champion ! :o)" or "MISSED : You are a loser ! ;P" based on that boolean.
The goal is to recover the correct 8-character key.
What makes this challenge interesting is not the individual operations (rotations, XORs, bitwise NOTs are standard fare) but where and how they execute. The transformation chain is split across Ring 3 (user mode) and Ring 0 (kernel mode), with both sides reading and writing to a shared memory page.
The user-mode main thread and a kernel system thread run concurrently, each dispatching operations based on different nibbles of the same opcode bytes written to shared memory. The interleaving of operations emerges from how these two threads synchronize through the opcode sequence, not from IOCTL calls.
Static reverse engineering is the natural starting point for a challenge like this, and under normal circumstances, a disassembler like Ghidra, IDA, Binary Ninja, or radare2 would be the right tool. This challenge is specifically architected to make pure static analysis laborious, requiring careful cross-referencing between two binaries. But it is solvable. We verified this by running the challenge through Ghidra’s MCP interface, which successfully recovered the flag using only static analysis.
The core issue is that the transformation logic lives in two separate binaries that execute in two separate privilege domains:
To reconstruct the full transformation chain statically, an analyst would need to:
0xf3a5c81e4b9d2d5a).0x3d8a41f9d7c5b16d).Each of these steps is individually tractable. Together, they represent a significant amount of manual cross-referencing. The shared memory adds complexity: user mode sees the accumulator at one virtual address (0x000001a6a0610015), while the kernel sees the same physical page at a completely different virtual address (0x0000011EF40B0015). A static analyst can infer the sharing from the code’s allocation and mapping APIs. Confirming the physical address correspondence is not strictly necessary to solve the challenge: the transformation chain can be reconstructed from the opcode array alone, since the synchronization mechanism makes execution order deterministic. Both sides iterate through the same 10 indices sequentially, using status bytes as a turnstile. The opcode array [0x10, 4, 2, 0x30, 0x40, 1, 0x40, 3, 0x20, 4] dictates the exact sequence, with no reordering or interleaving possible.
We ran the same challenge through Ghidra’s MCP interface (ghidramcp) with Claude to verify that static analysis can solve it. Using the same model (glm-5) on the same machine, in a fresh session, the agent successfully decompiled the user-mode binary and extracted the opcode sequence, the shared memory layout, and the XOR decryption key for the embedded driver. Since Ghidra MCP could not access the PE resource section directly, the agent used Bash with Python scripts to parse the PE structure, extract and decrypt the embedded driver, and disassemble it with objdump. From the driver’s system thread and IOCTL handler, the agent recovered the kernel-side operations and the hardcoded comparison target. Reversing all 10 operations yielded the correct 8-character key. The static analysis approach succeeded, confirming that this challenge does not require execution or dynamic analysis. The process took several hours and 79 tool calls, reflecting the manual work needed to bridge the two binaries and extract the encrypted driver.
Static analysis recovered everything needed: the transformation chain, the hardcoded target, and the correct key. The limitation is not capability but effort. Static analysis tells you what a program can do, and from that, a careful analyst can deduce what it does.
Time travel debugging offers a different tradeoff: instead of deducing the execution path from code, you query a recorded trace directly. The analyst trades upfront effort (manual extraction, cross-referencing, driver decryption) for a query-driven workflow that navigates the trace in minutes.
The entire challenge was solved using our time travel debugging trace, accessed through an MCP (Model Context Protocol) server that exposes the recorded execution as a set of queryable tools. The trace captured approximately 79.3 million transitions (instructions) of the program’s full execution, including both user-mode and kernel-mode activity.
Here is what that capability concretely enabled:
The most powerful primitive in this workflow is search_memory_accesses, the ability to ask “who wrote this value to this address, and when?” Given the address of the decision variable ([rbp-0x34] in the user-mode comparison), we traced backward to find it was written by a kernel-mode ntoskrnl memcpy, which copied it from the IRP’s SystemBuffer, which was written by the driver’s comparison logic. Each step was a single query, and each answer pointed directly to the next question.
This same primitive, applied forward (“who reads from this address after this point?”), let us follow the input bytes from the initial user-mode buffer through the transformation chain.
The translate_address tool converts virtual addresses to physical addresses. This was essential. When we found that the accumulator was being written at virtual address 0x000001a6a0610015 in user mode and 0x0000011EF40B0015 in kernel mode, translating both to their physical address confirmed they mapped to the same page: phy:0x0000000028507015. Without this, correlating writes across the privilege boundary would have required manual page table walks.
While WinDbg’s !vtop command can translate virtual to physical addresses, it requires kernel debugging mode, finding the target process’s CR3 (DirectoryBase), and manually switching context with .process. Our approach provides this as a single query on a recorded trace, without needing a live kernel debugger session.
At any of the 79.3 million transitions, we could inspect the complete register file and read arbitrary memory. This let us:
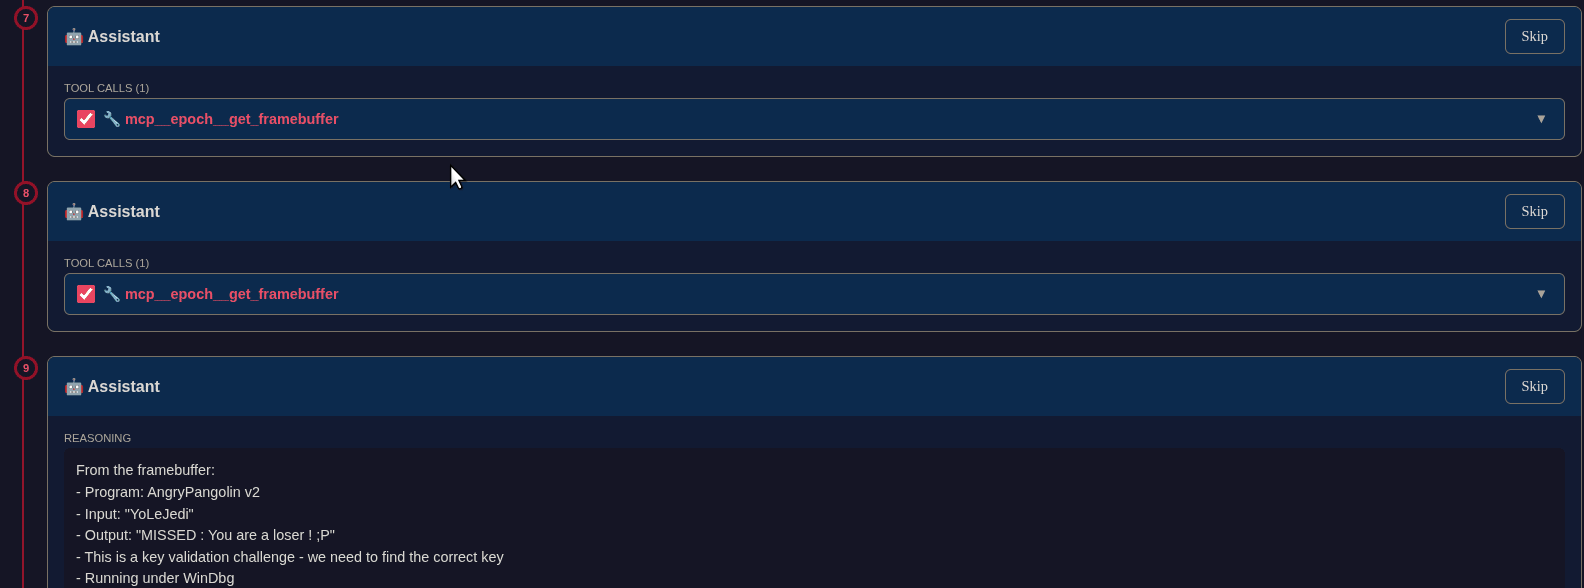
setz instruction write 0 (failure) because the transformed input did not match the hardcoded target.The trace includes framebuffer snapshots, the actual screen contents at any point in time. We gave eyes to the MCP tool: it could see what was on screen at any moment during the recorded execution. Reading the framebuffer at context 0 (start) and context 79,344,271 (end) immediately revealed the challenge type: a key prompt, the test input "YoLeJedi", and the failure message. No guessing, no disassembly of printf calls. Just the actual screen output.
By combining backward causality tracing (from the decision point to the driver, from the driver to the transformation chain) with forward tracing (from the input through each operation), the agent reconstructed the complete 10-step transformation:
Every operation is its own inverse (rotations reverse with opposite rotations of the same width; XOR and NOT are self-inverse). Reversing the chain from the hardcoded target yields:
Applying the inverse chain to the target value produces a clean 8-byte ASCII string: the correct key.
Verification against the known test input confirmed correctness: processing "YoLeJedi" (0x6964654a654c6f59) forward through all 10 steps produces 0xd1b0a14eac63c493, matching the value observed in the trace’s SystemBuffer.
The traditional workflow for a challenge like AngryPangolin involves iterating between a disassembler and scripts or debuggers, manually extracting embedded components, cross-referencing functions across binaries, and reconstructing the logic by careful reading. It works. The Ghidra MCP session proved it works. It is also laborious, requiring manual work to extract the encrypted driver.
What MCP-based time-travel debugging offers is a different query model. Instead of “reverse engineer this function, then that function, then manually correlate them,” the analyst asks questions directly about the recorded execution:
These are declarative questions about the execution. The trace is a complete, indexed, queryable record of everything that happened. The analyst does not need to extract embedded drivers, decrypt XOR payloads, or manually parse PE structures. The execution already happened; the trace captures both user-mode and kernel-mode activity; the MCP tools are the query interface. The entire AngryPangolin challenge, from first look to solved key, was completed in 6 minutes using this approach, compared to several hours for the static analysis path. The program was run once under a trace recorder, and from that point on, all analysis was performed by an LLM agent querying the recorded trace through MCP tools, demonstrating that this query-driven model enables rapid automated reasoning over complex executions.
For a reverse engineer, the concrete benefit is this: the MCP trace interface reduces what would be hours of manual static analysis across two privilege domains and an embedded encrypted driver to a directed sequence of causal queries. Each query returns a precise answer, and each answer informs the next query. There is no need to extract the driver, decrypt it, or manually parse PE structures. The agent follows the data.
This writeup presents a single case study. The AngryPangolin challenge, while genuinely complex in its Ring3/Ring0 split, is one data point. A more systematic comparative evaluation, measuring solve times, accuracy, and analyst effort across a broader set of challenges and analysis approaches, is planned for a later phase. The goal of that evaluation will be to quantify, rather than just demonstrate, the advantages that time travel trace analysis brings to reverse engineering workflows.


