Pierre Mondon
|
0
|
May 19, 2025


Lately, we’ve been hearing the same question from security analysts again and again: What’s the difference between WinDBG and the Time Travel feature in esReverse?
Or, more directly: Why would you pay for esReverse when WinDBG’s Time Travel Debugging (TTD) is free?
It’s a fair question.
If you work in vulnerability research or malware analysis, chances are you’ve used WinDBG’s Time Travel Debugging. It’s a solid tool for tracing user-mode execution, stepping backward through crashes, and digging into application-level bugs. It’s free, well-documented, and deeply integrated into the Windows ecosystem.
So, why build something else?
Because once your investigation goes beyond a single process—such as when it spans kernel activity, cross-process behavior, or system-wide effects—you start hitting the limits of what WinDBG can show you. That’s where esReverse comes in.
In this post, we’ll break down what WinDBG TTD does well, its core limitations, and how esReverse is built for a entirely different job: understanding full systems, not just stepping through code.
Let’s start with the basics.
WinDBG (short for Windows Debugger) is Microsoft’s official debugger for Windows. It has been a staple tool for years, widely used by developers, security researchers, and reverse engineers to inspect and debug code running on Windows environments.
At its core, WinDBG lets you attach to a process or load a memory dump to walk through the execution flow. You can:
While incredibly powerful, it isn't exactly beginner-friendly. Most people using WinDBG already know their way around low-level Windows internals.
To make debugging more flexible, Microsoft introduced Time Travel Debugging (TTD) around 2016. TTD allows you to record the entire execution of a program and move forward or backward in time, helping you trace exactly how a program reached a specific state.
TTD works by recording the execution of a user-mode process into a trace file. This trace captures every instruction the process runs, alongside relevant system state and memory changes. Once the recording is done, you load it into WinDBG to navigate the timeline.
You can step through execution forward and backward, pause, inspect memory, and trace how specific values evolved. This is exceptionally useful when analyzing crashes or subtle logic bugs.
Additionally, TTD supports scripting. Using JavaScript, analysts can automate trace analysis, set conditions, extract insights, and build repeatable workflows.
Despite its utility, WinDBG TTD has clear limitations, especially for complex security research:
For vulnerability research, this means you may only capture the triggering conditions of a bug—not how the system reacts or how an exploit ultimately completes.
For malware analysis, you might see a loader in action, but you won't see how it sets up persistence, modifies system states, or passes control to the final payload.
WinDBG TTD is a strong debugger. But at the end of the day, it is still just a debugger. If you need deeper visibility across time, memory, and system layers, you need a tool purpose-built for that scope.
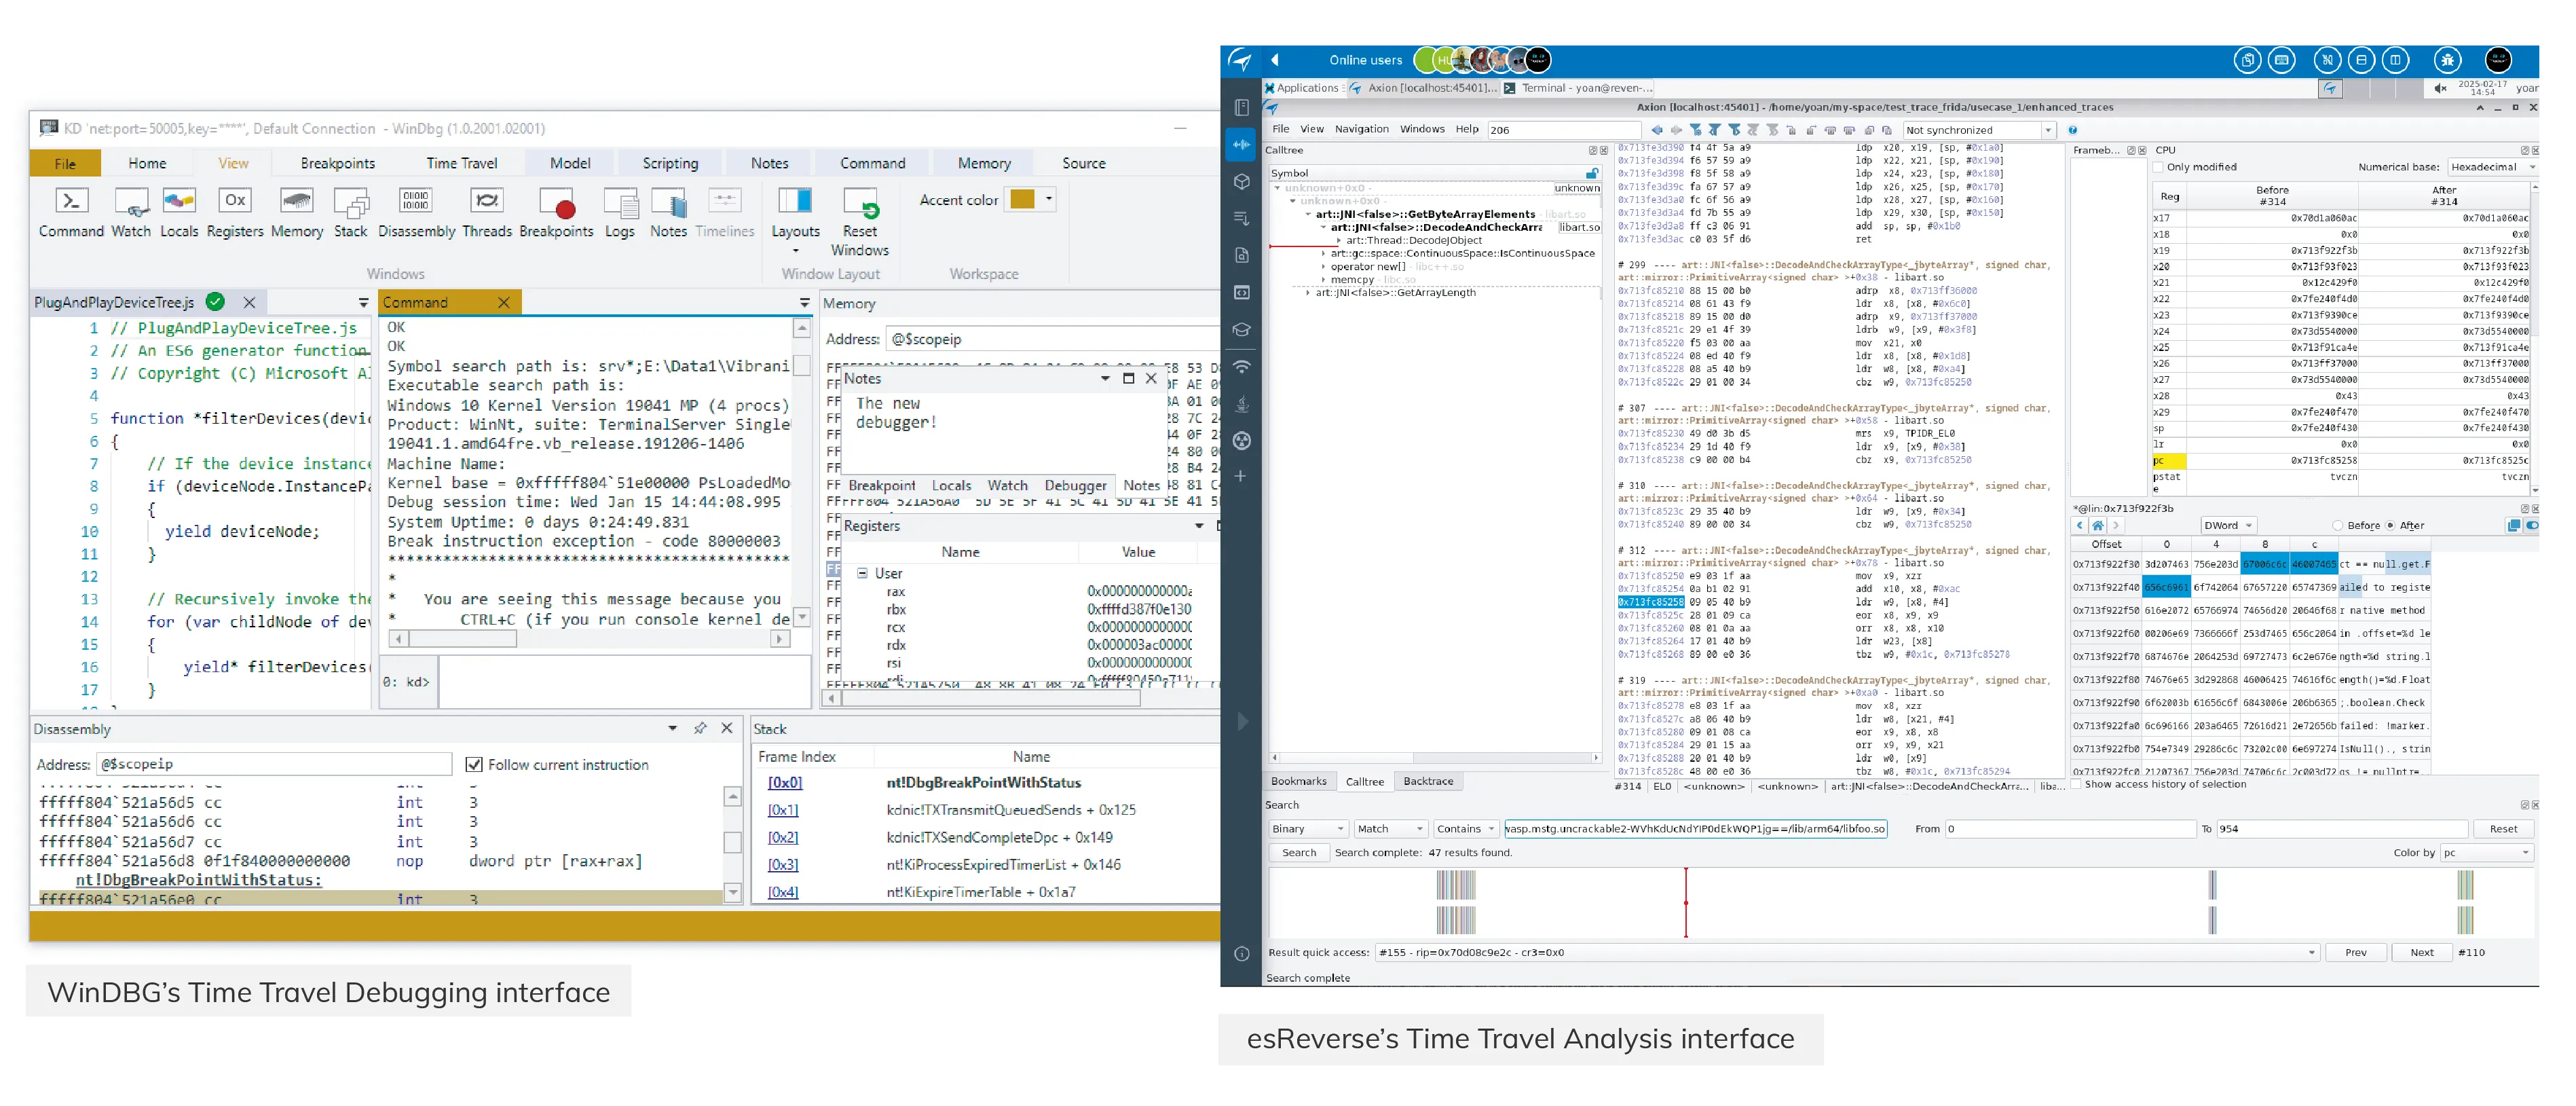
esReverse enables Time Travel Analysis on a full-system emulation. Instead of tracing a single process, you analyze how an entire operating system behaves over time.
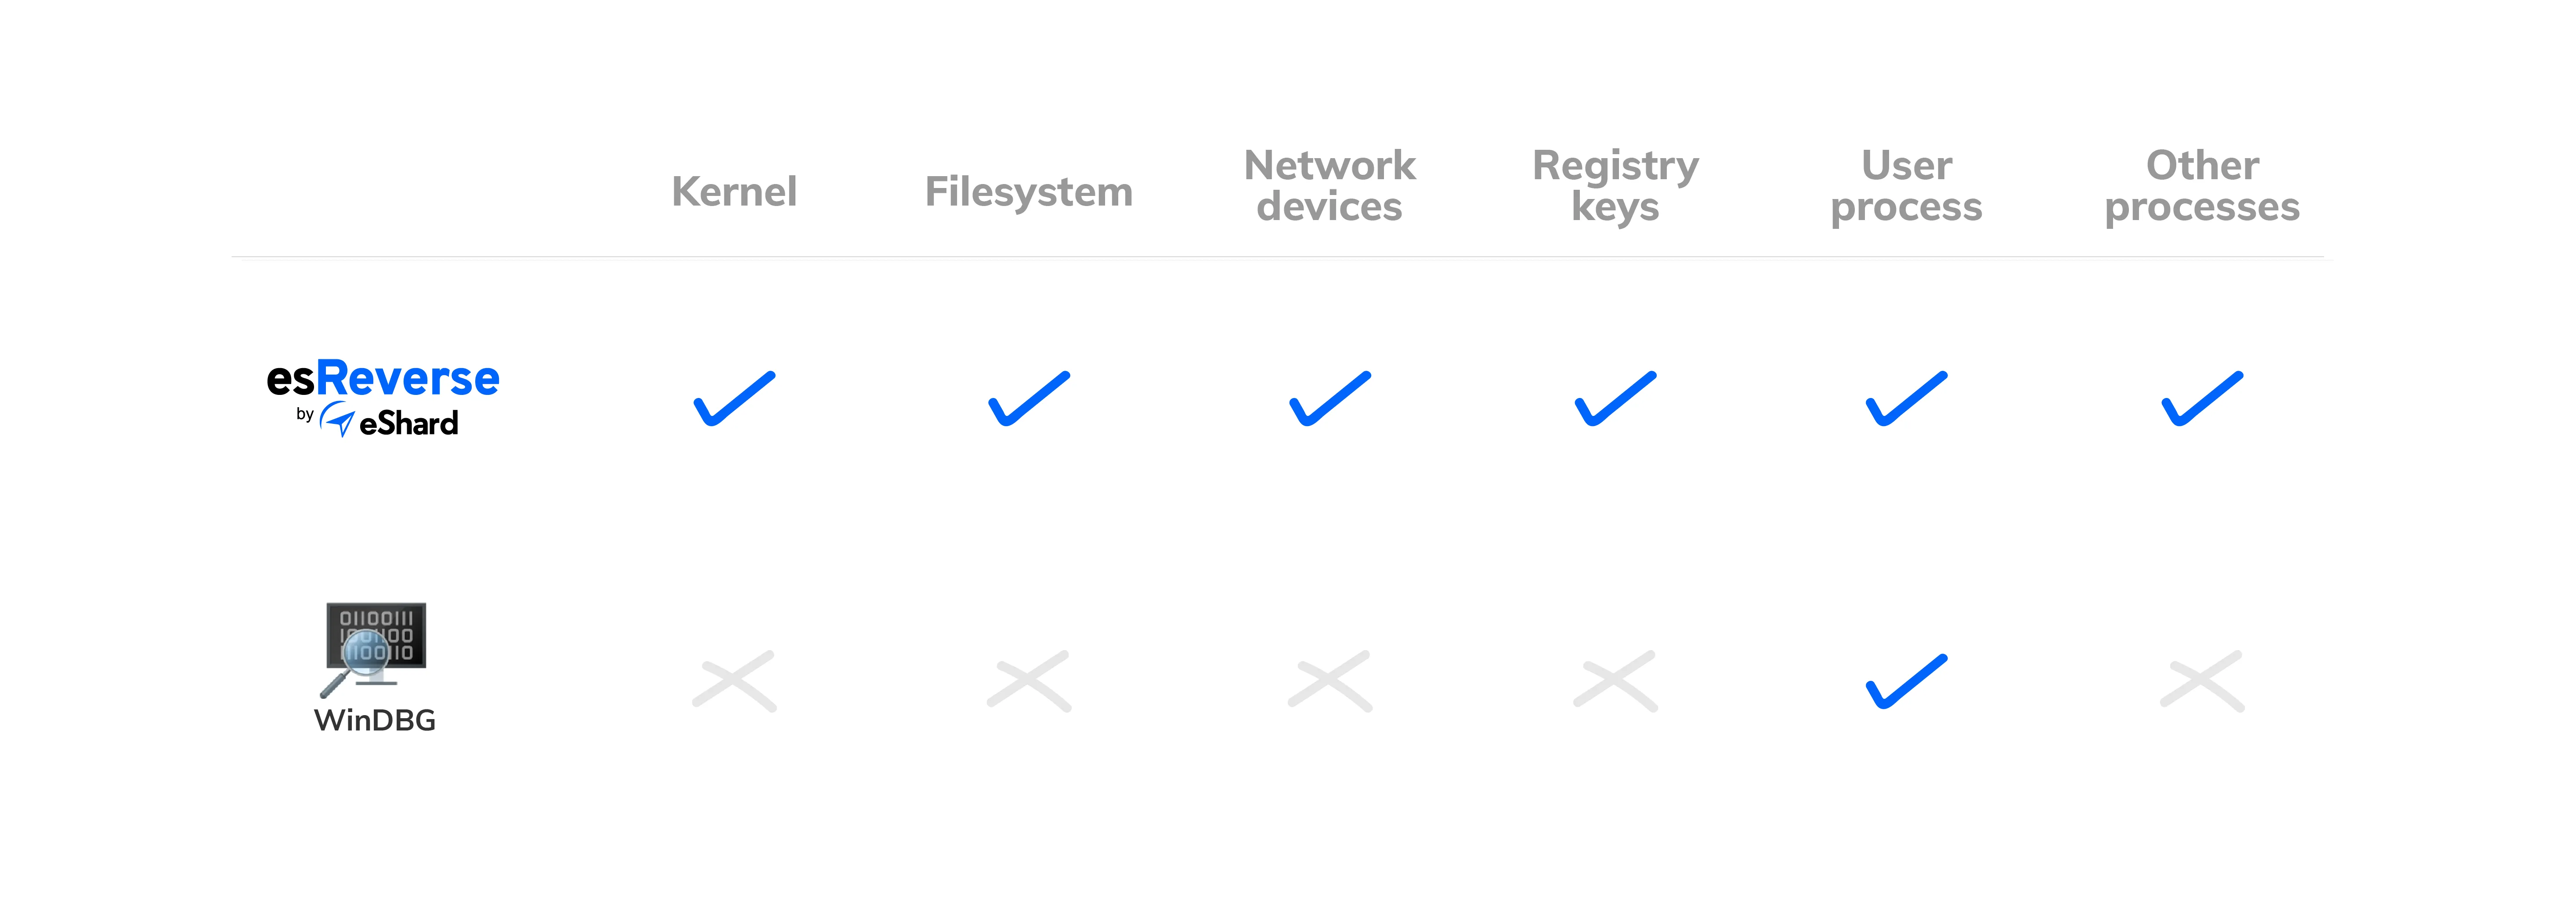
With esReverse, you can boot a full OS (like Windows, Linux, or Android) and move back and forth through its total execution. This includes:
You get the full picture, not just an isolated piece. This is crucial when behavior crosses boundaries. For example, if a driver triggers a crash but the root cause started in userland, or if a payload appears in memory but wasn’t written by the process you're debugging. Regular debugging tools struggle here; full-system analysis thrives.
On Intel platforms, esReverse also supports taint analysis. This allows you to track how a piece of data was created and where it flows, even as it moves between user and kernel space, or across multiple threads and processes.
Furthermore, you can automate your analysis with a Python API, generate execution coverage, and connect with reverse-engineering frameworks like Binary Ninja. Built-in modules allow you to extract pcap network data, view file system events, and search physical memory for access patterns.
Unlike traditional debuggers, esReverse features a custom GUI designed specifically for this exact workflow. That’s why we refer to it as Time Travel Analysis—because it goes far beyond simple debugging.
Both WinDBG and esReverse are powerful tools, but they are built for entirely different jobs.
If you are debugging a user-mode application and want to step through code to find a software bug, WinDBG makes perfect sense. It’s fast, free, and tightly integrated into standard Windows development workflows.
But if you are a security analyst who needs to go deeper—following data between components, understanding kernel behavior, and reverse-engineering complex exploits—esReverse gives you the keys to the whole kingdom: userland, kernel, inter-process activity, physical memory, and system state over time.
The Bottom Line:
Use WinDBG when you want to debug code.
Use esReverse when you need to understand full systems.


