Lionel d'Hauenens
|
0
|
October 14, 2026


Understanding what malware is capable of is one thing. Observing what it actually does when executed is another. Static analysis provides valuable insights into a binary's structure and potential capabilities, but dynamic analysis reveals its runtime behavior: the instructions executed, the memory accessed or modified, and the interactions with the operating system.
For malware analysts, being able to revisit that execution is particularly valuable. With Time Travel Debugging, an execution can be recorded and explored forwards or backwards, making it possible to trace a suspicious behavior back to its origin, inspect the state of memory and registers at any point, and investigate without repeatedly executing the malware.
This is where Epoch comes in. It provides the execution trace and the tools to investigate it, including through an LLM capable of querying the recorded execution. But before any analysis can begin, we need a reliable recording.
Getting one is not necessarily difficult, but it involves a sequence of meticulous operations: restore a clean VM, verify its network isolation, transfer the binary, execute it, start recording at precisely the right moment, stop the VM, and index the trace.
What if all of this could be handled with a single sentence?
That's exactly what we demonstrate in this article.
An LLM can be connected to Epoch through tools (an MCP server): it can then start a VM, launch a recording and trigger indexing. But above all, it can analyze the trace: step through the execution instruction by instruction, read registers and memory at any point in time, find which instruction wrote a given value, and reconstruct the malware's behavior.
Among these tools, those for Virtual Machine Introspection (VMI) are the key to this article. They let you control the VM from the outside, without installing anything in the guest operating system: follow a process, pause the VM at exactly the right moment, then open the recording right at the binary's entry point. The first instruction in the trace is therefore the first instruction the program actually executes.
Following a written procedure that spells out the order of the steps, which checks to run before each one and when to stop, the LLM carries out these operations without any intervention.
The result: you describe what you want, and the sequence of operations is handled for you.
We start from a Windows 11 26H2 VM and its snapshot, both already prepared. The VM was built with Lite VM Studio, our LLM-driven tool that builds a lightweight Windows VM suited to recording from a single prompt. To build your own, read our article Lite VM Studio builds your Windows VM, so you don't have to.
Here is what we type:
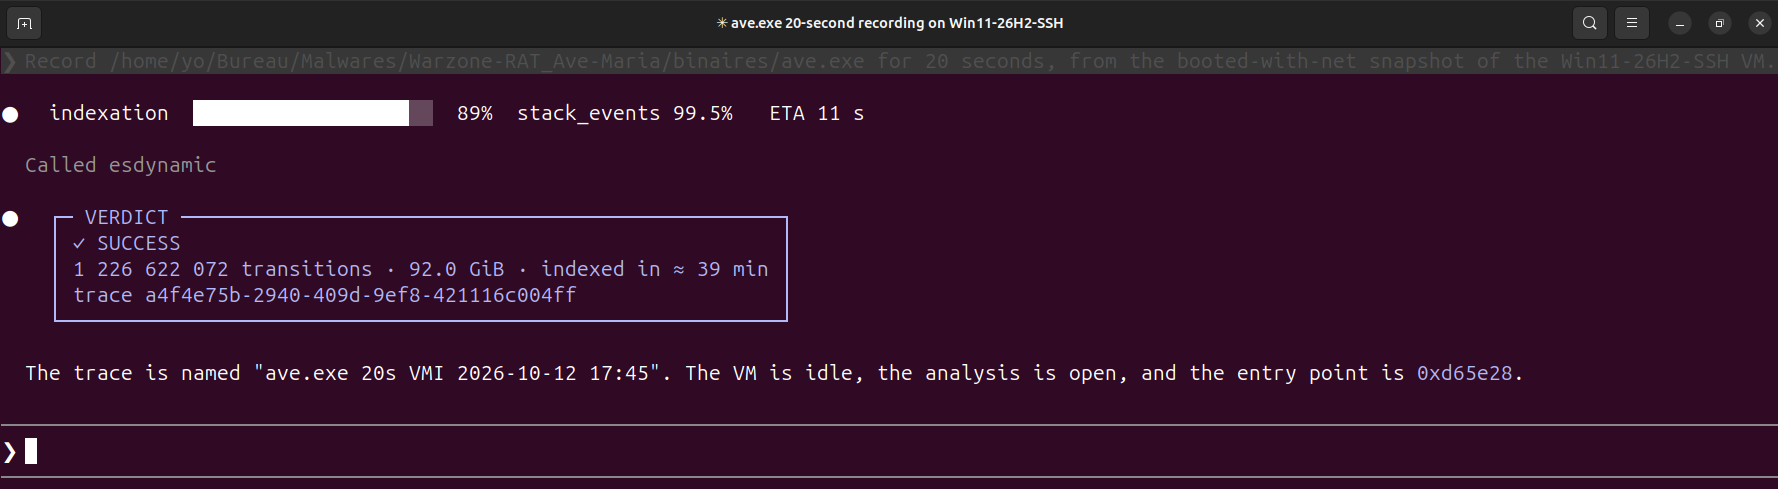
Record /home/yo/Bureau/Malwares/Warzone-RAT_Ave-Maria/binaires/ave.exe for 20 seconds, from the booted-with-net snapshot of the Win11-26H2-SSH VM.
Three pieces of information are enough:
💡 Choosing when to stop recording. Here we set a fixed duration, but it is not the only option: you can also ask to record the binary's entire execution, from its entry point until it exits. That works because Epoch can stop a recording as soon as a process ends.
In every case, it is a good idea to set a safety limit: some malware never exits on its own, and the recording would then never stop. So you set a maximum duration, and recording stops when the binary exits or when that duration is reached, whichever comes first. Finally, the longer the binary runs, the longer the trace gets and the more time indexing takes.
From here on, we don't intervene.
Nothing starts until everything has been checked: the VM is powered off, the snapshot exists, and the file really is a Windows executable. The VM is then started from the snapshot, which takes a few seconds.
Before any file is dropped, we check that the VM is isolated from the network (the emulator's restrict=on option must be active). If it were not, the run would stop right there, with nothing transferred.
The binary is then copied to the VM's desktop, and its SHA-256 hash is compared with the original file's.
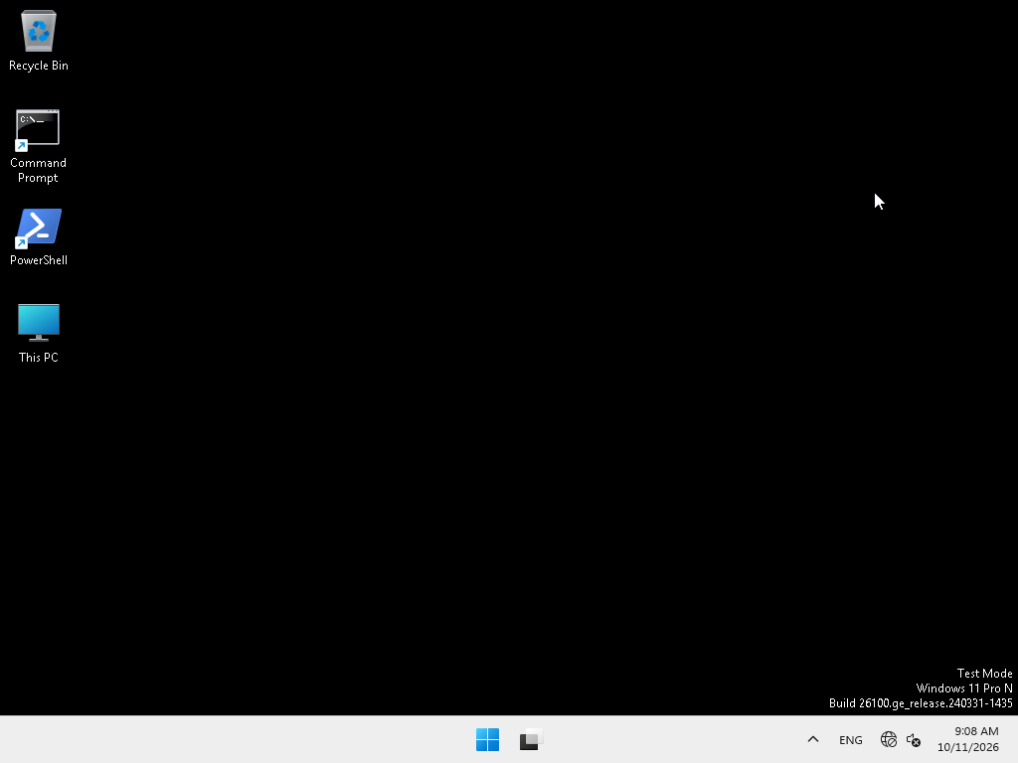
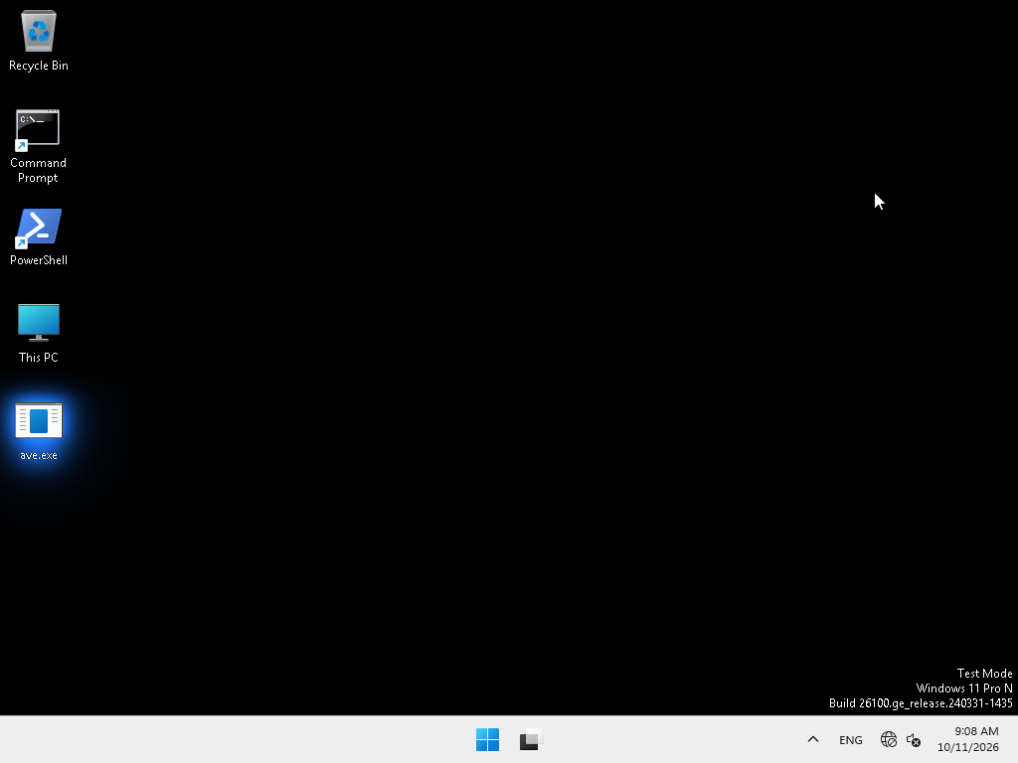
The binary is launched from the host. Meanwhile, VMI tracks the process from outside the VM. As soon as the process reaches its entry point, the recording opens; it runs for the twenty seconds requested, and then the VM is stopped.
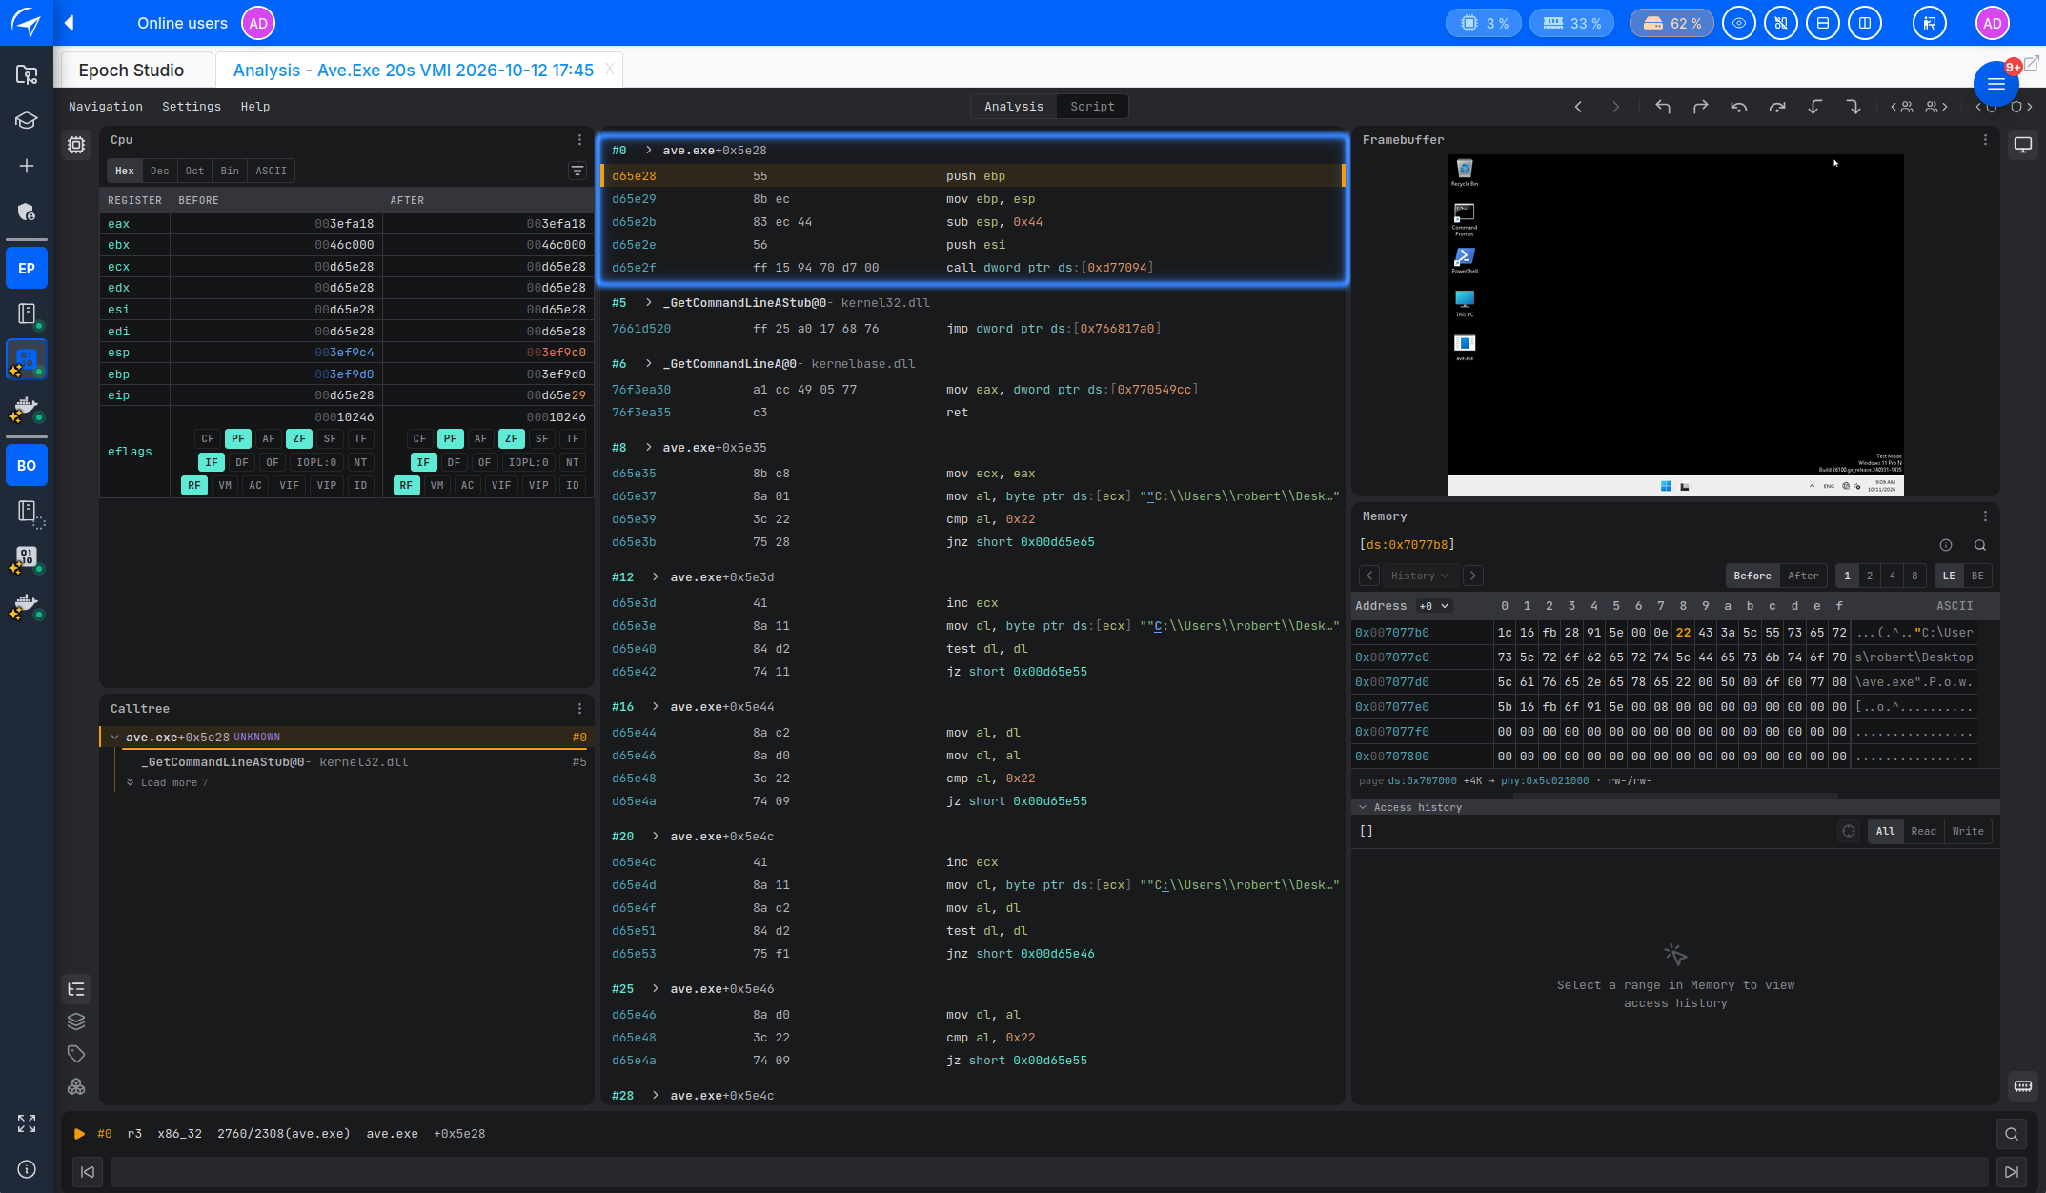
The entry point's address changes from one run to the next (ASLR), so it is read every time, never hard-coded. Its offset within the binary, on the other hand, is fixed: for ave.exe, it is ave.exe+0x5e28.
💡 Under the hood. The memory page containing the entry point has usually not been loaded yet when the process gets there. If we started recording right away, the trace would begin with tens of thousands of kernel instructions that load that page. So we let the page fault happen, and the recording only opens the second time execution reaches that address: the trace then starts at the program's very first instruction.
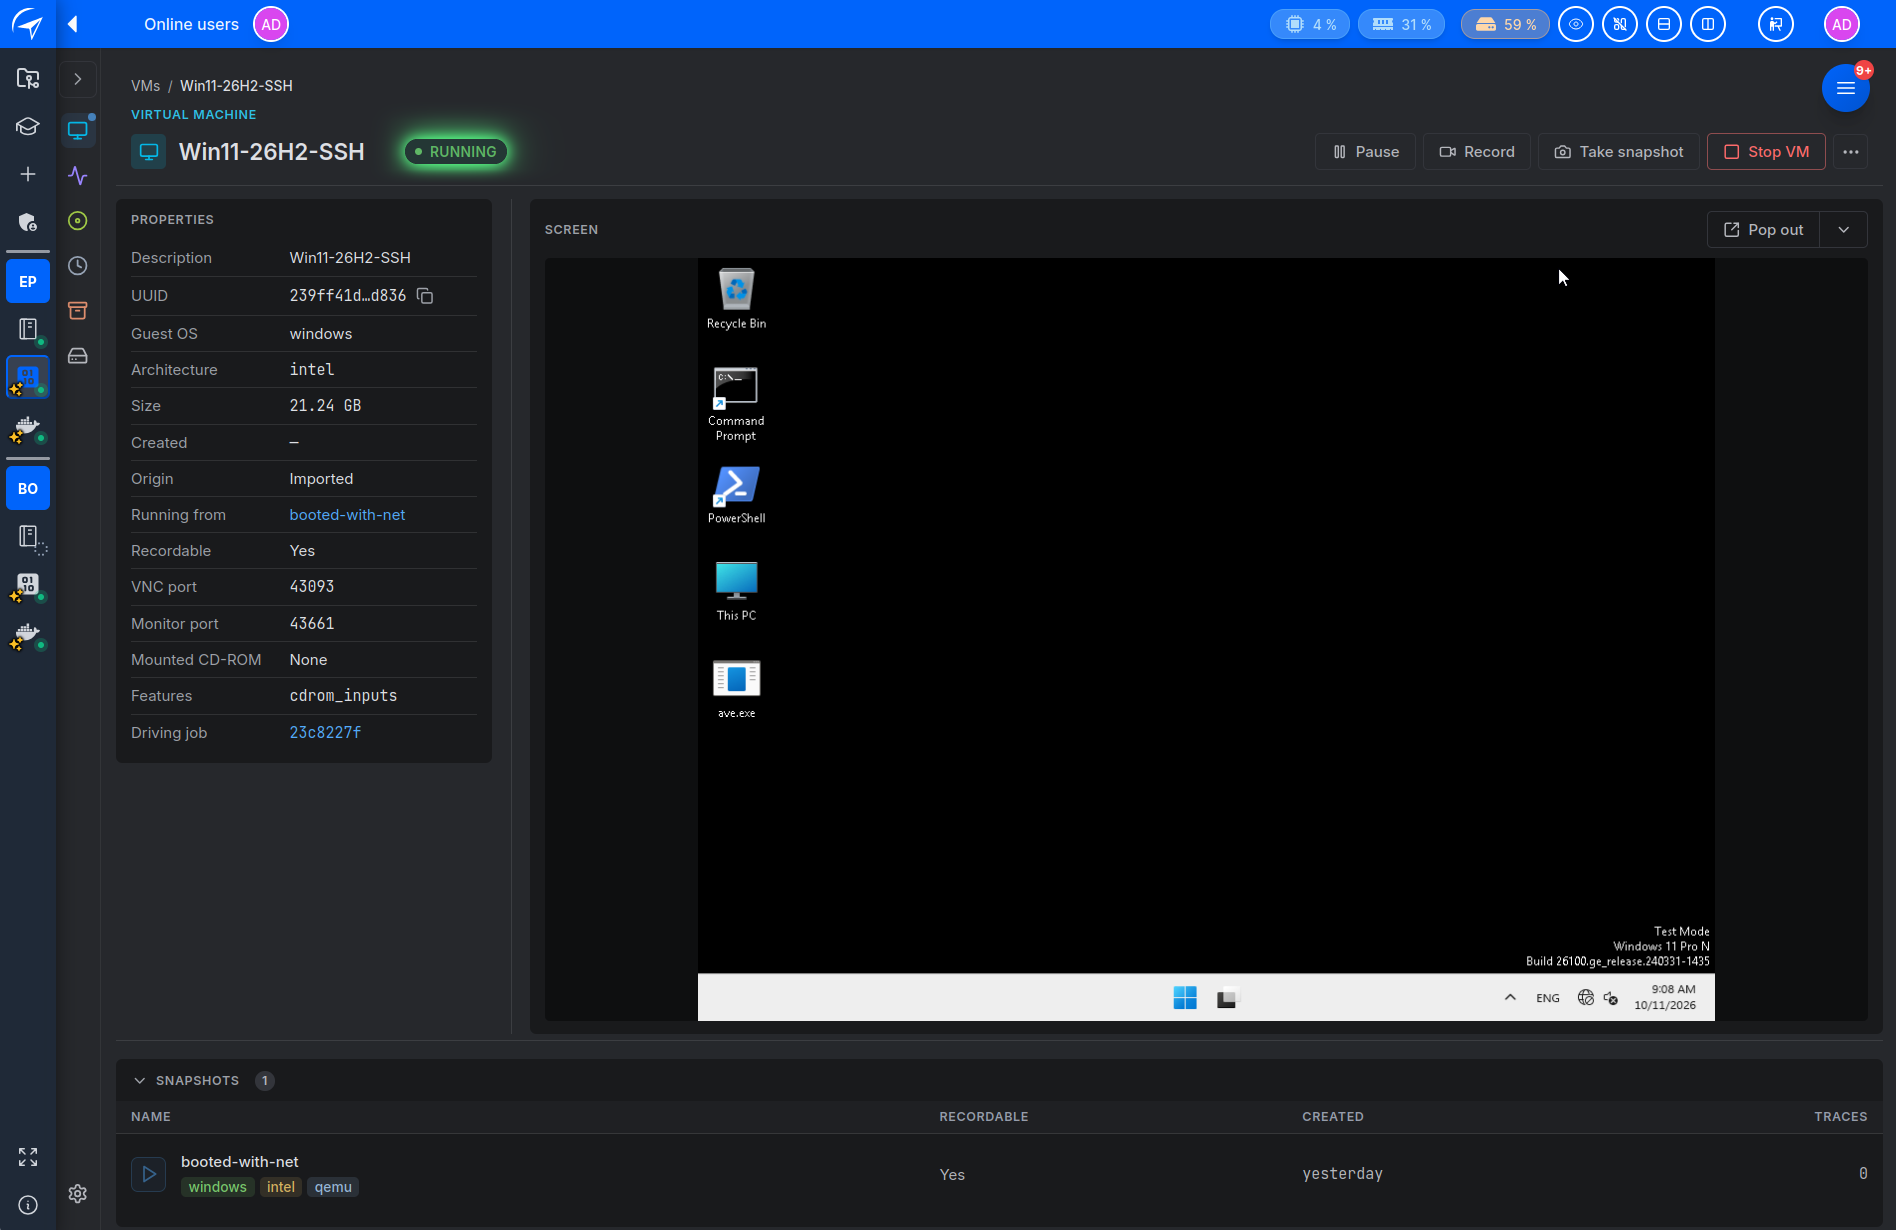
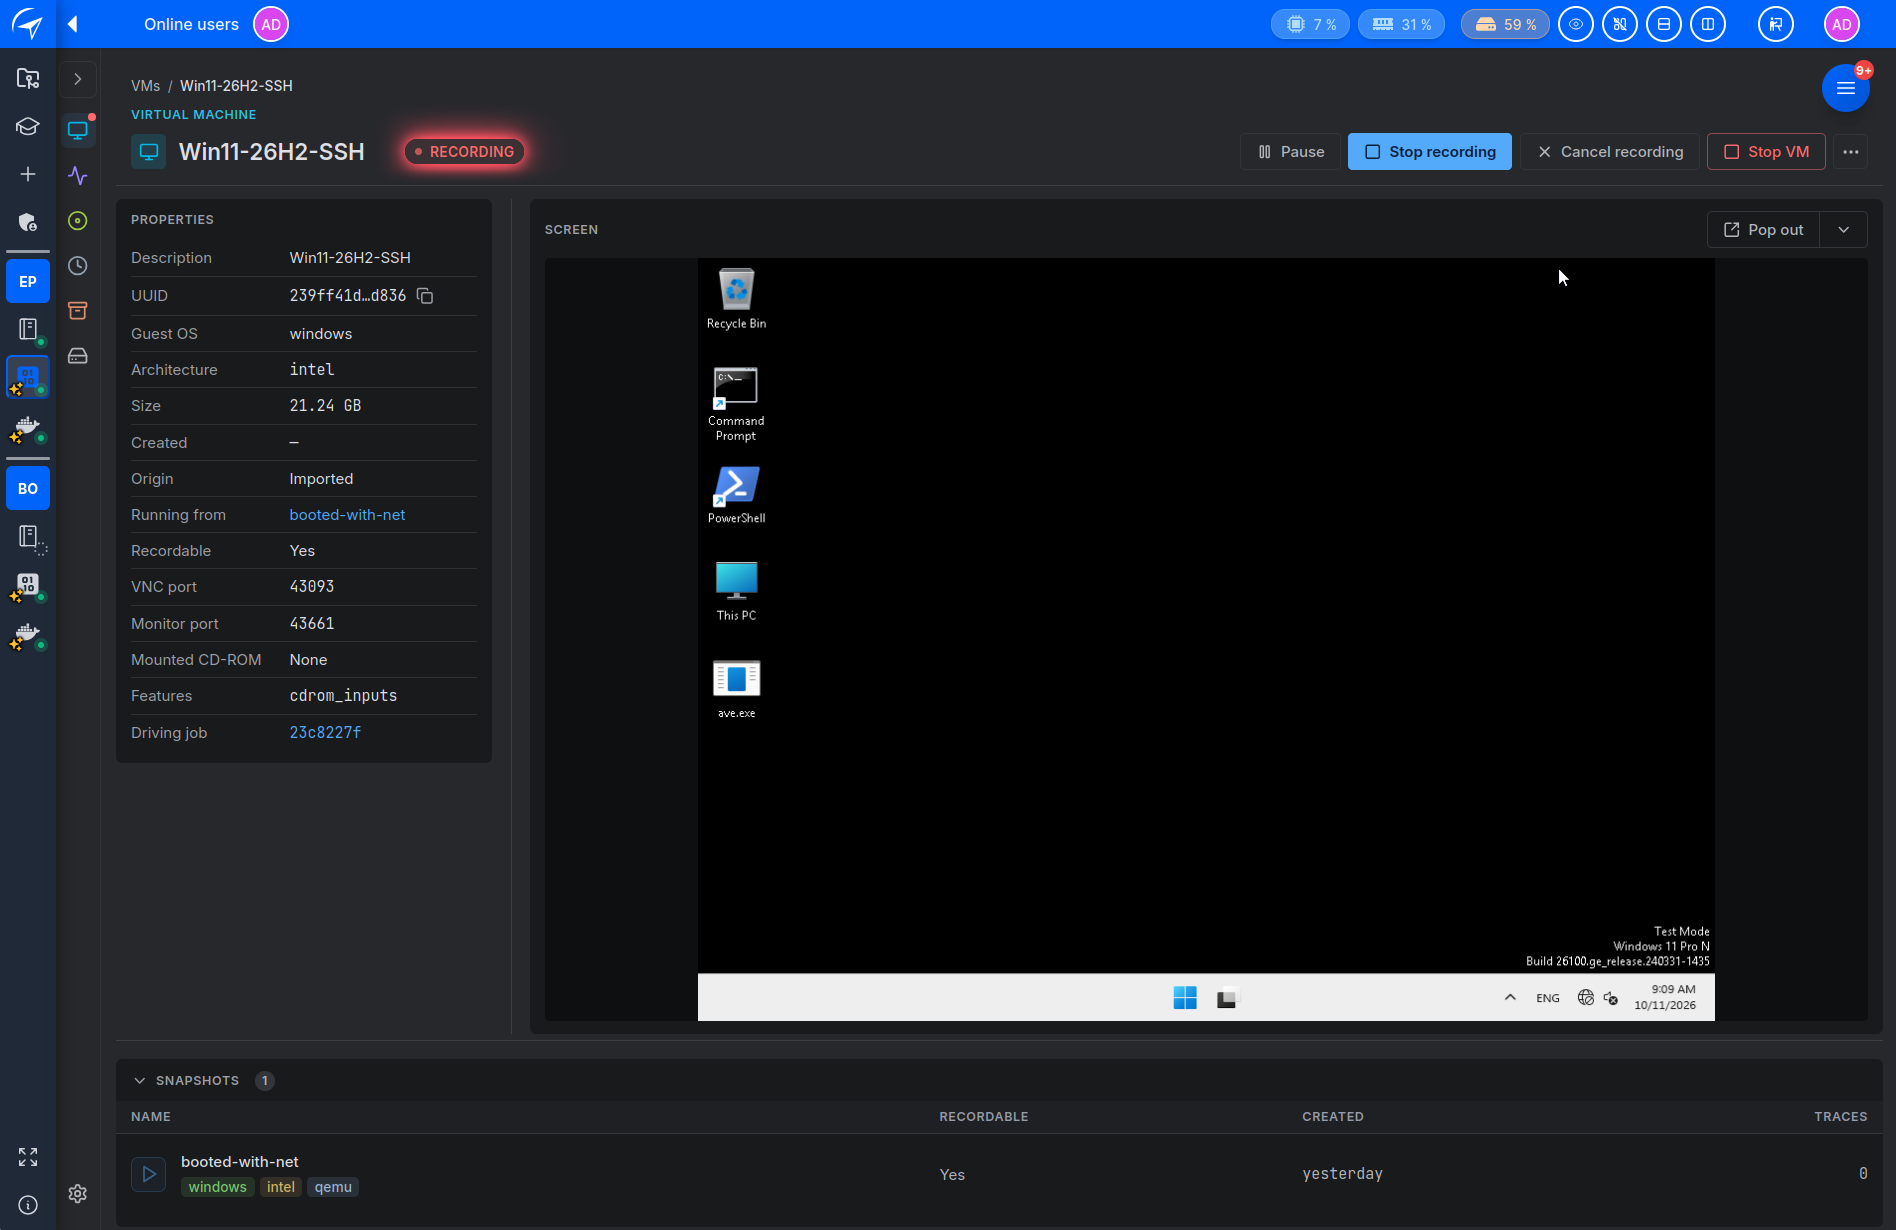
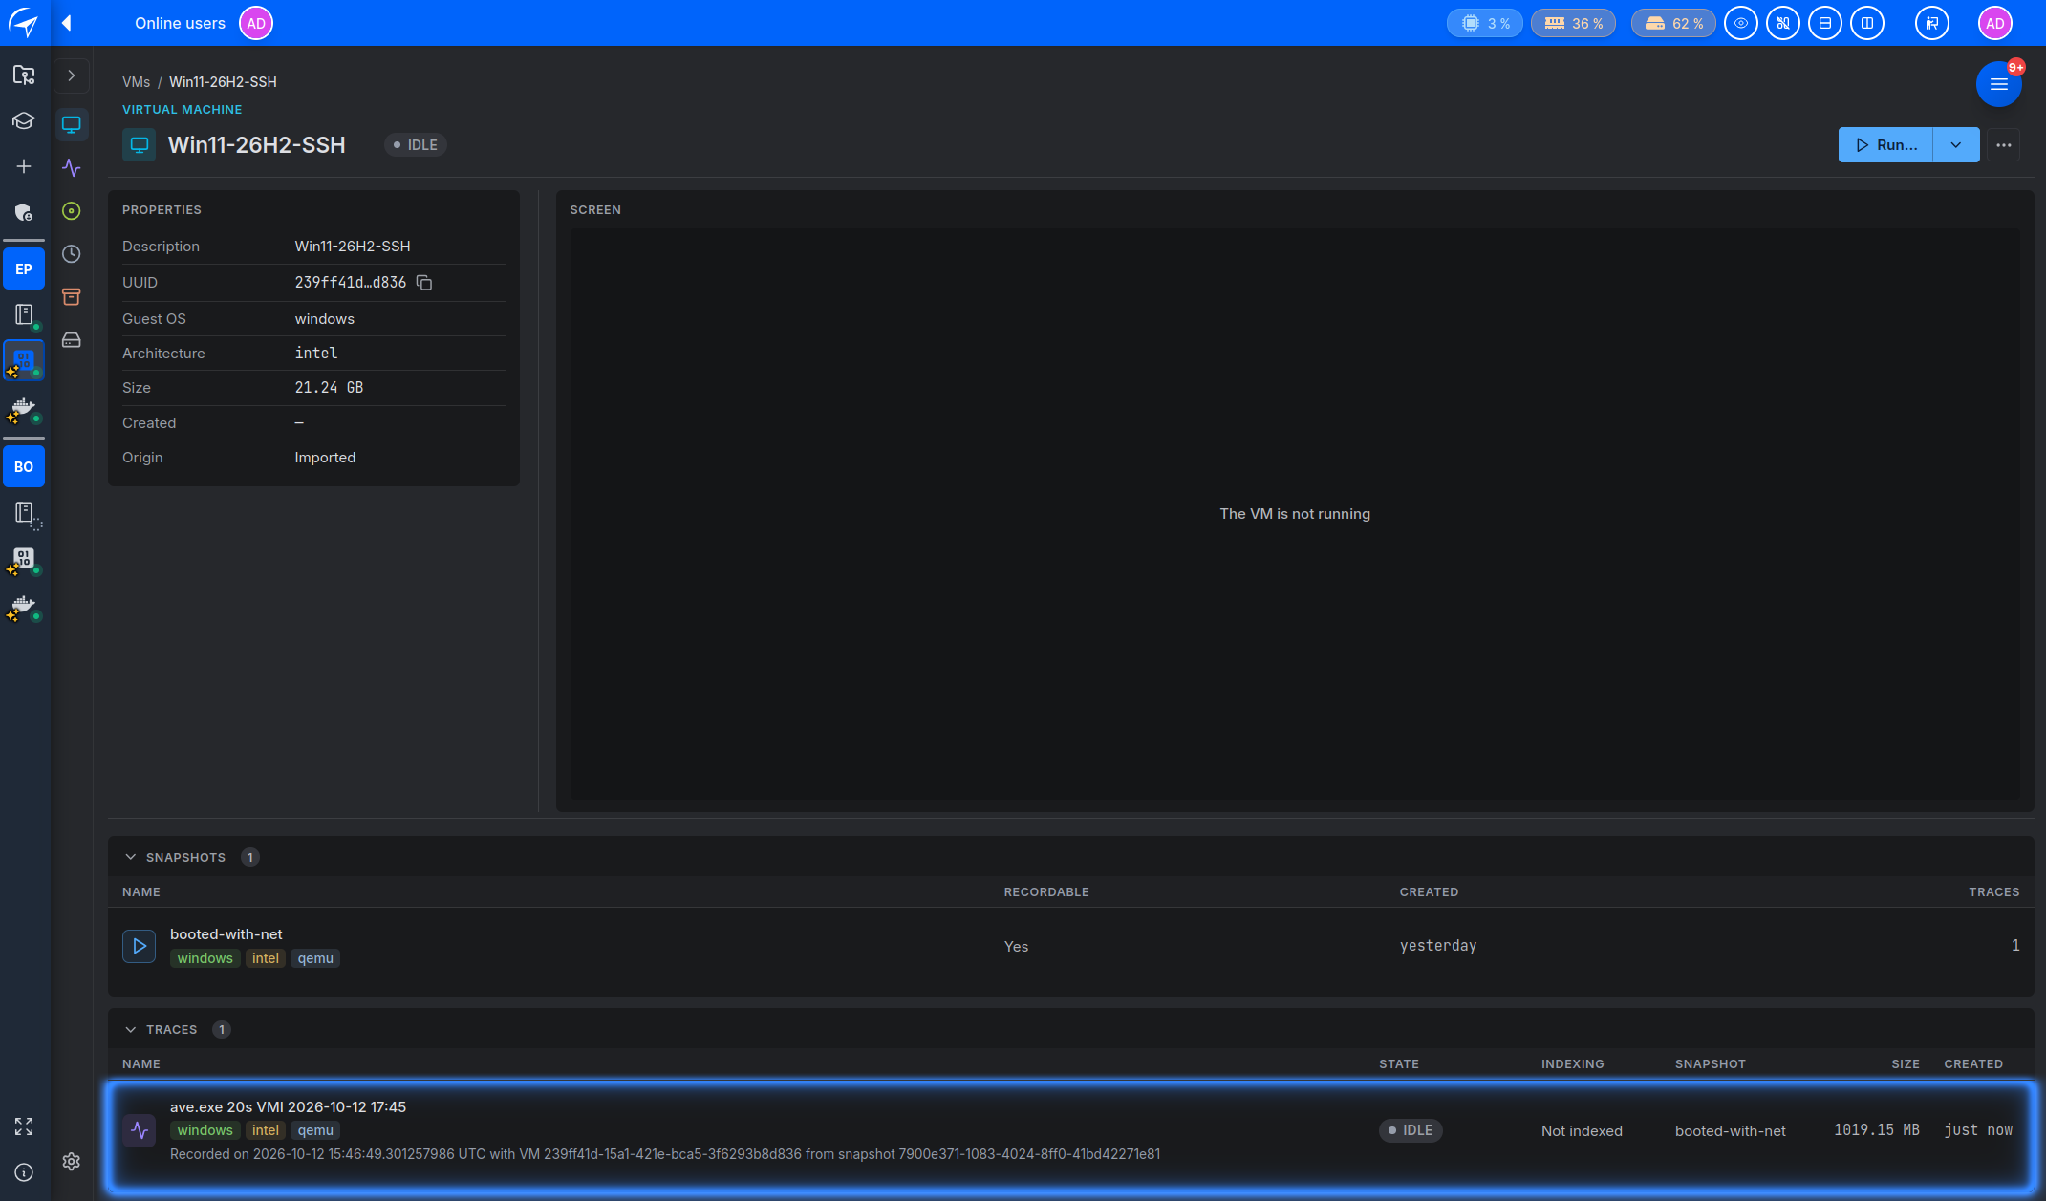
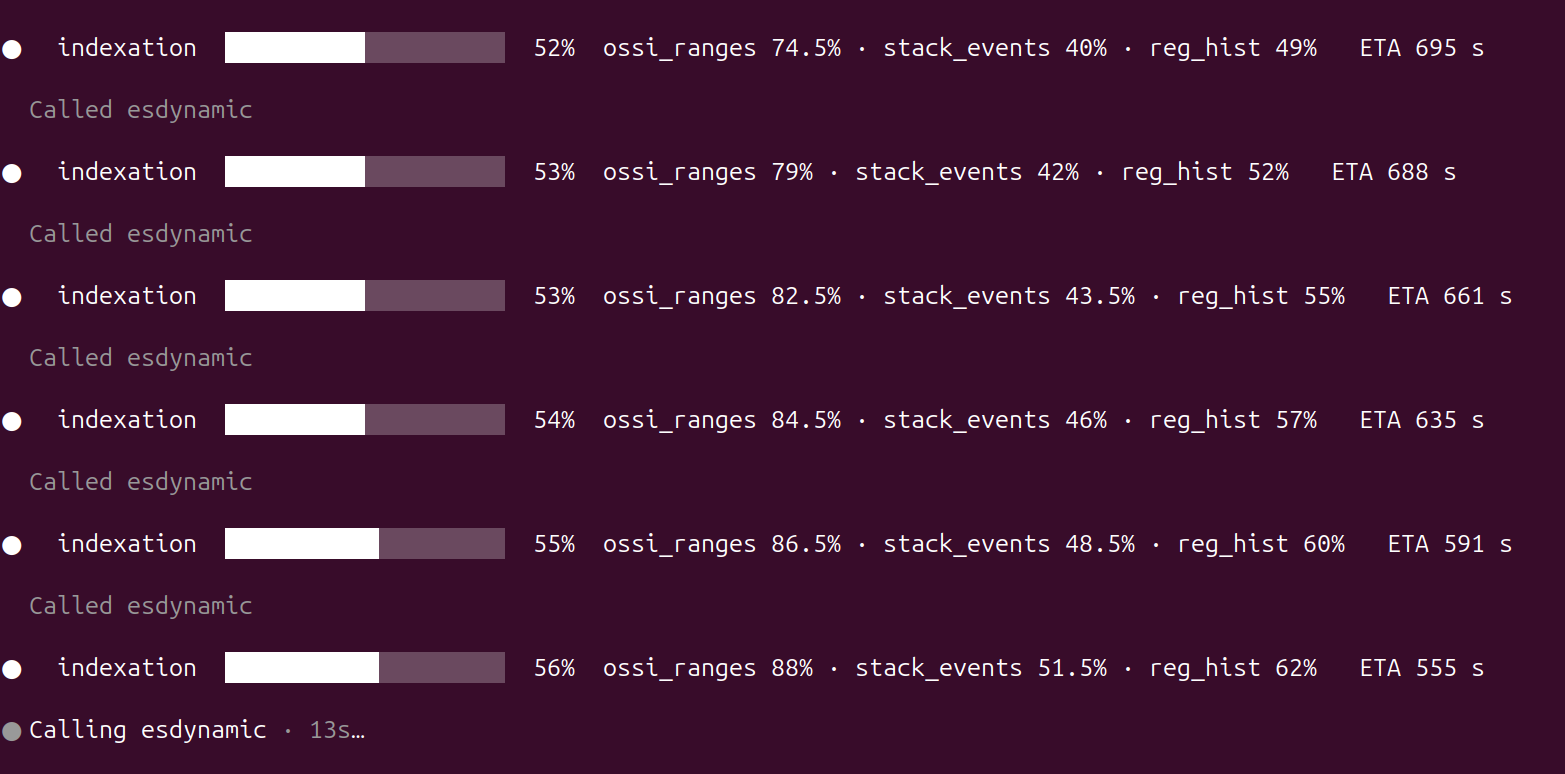
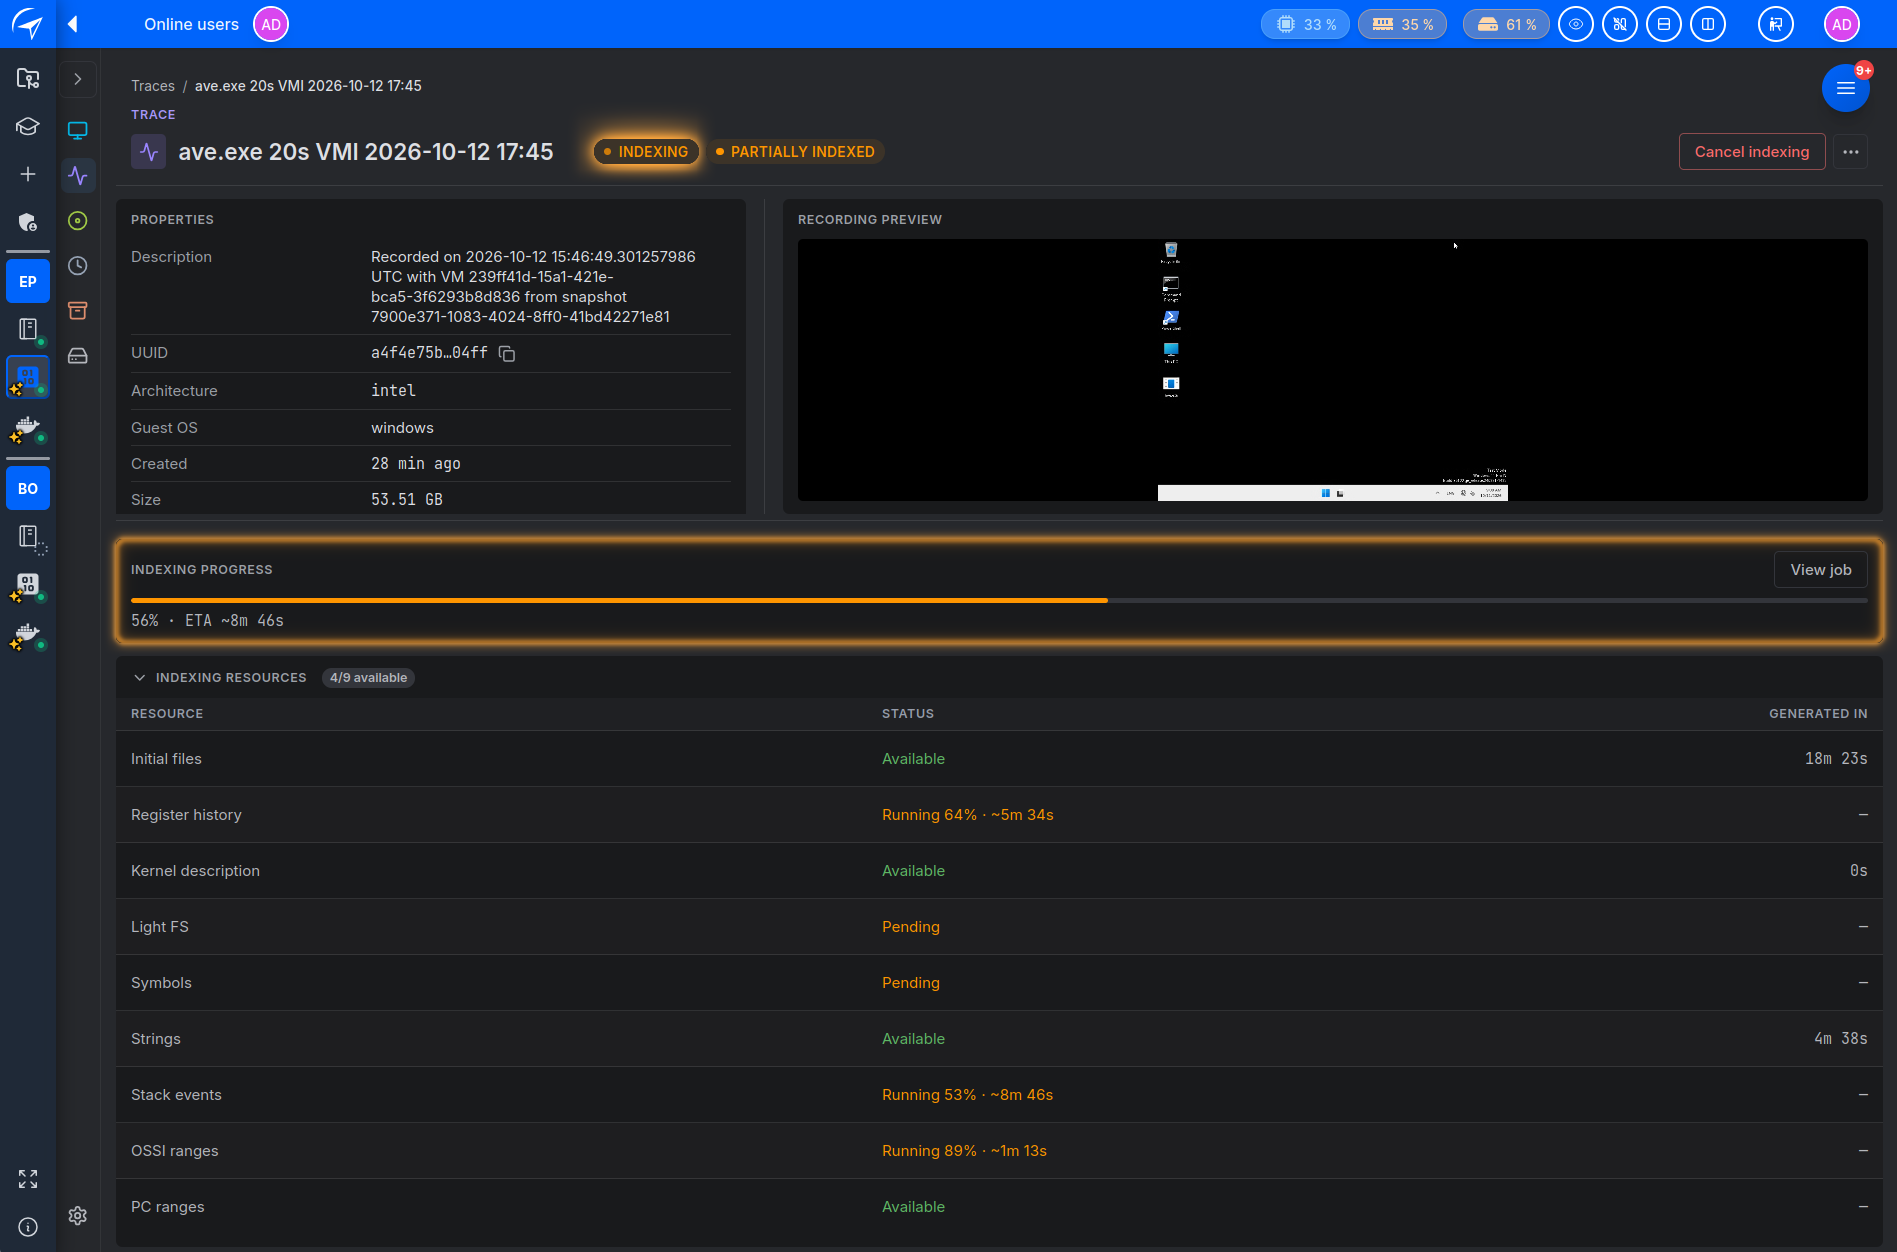
Once the VM has stopped, indexing of the trace is launched and its progress is displayed. Epoch replays the execution, then builds its indexes (memory and register history, call stack, symbols…). This is the longest step of the whole workflow.
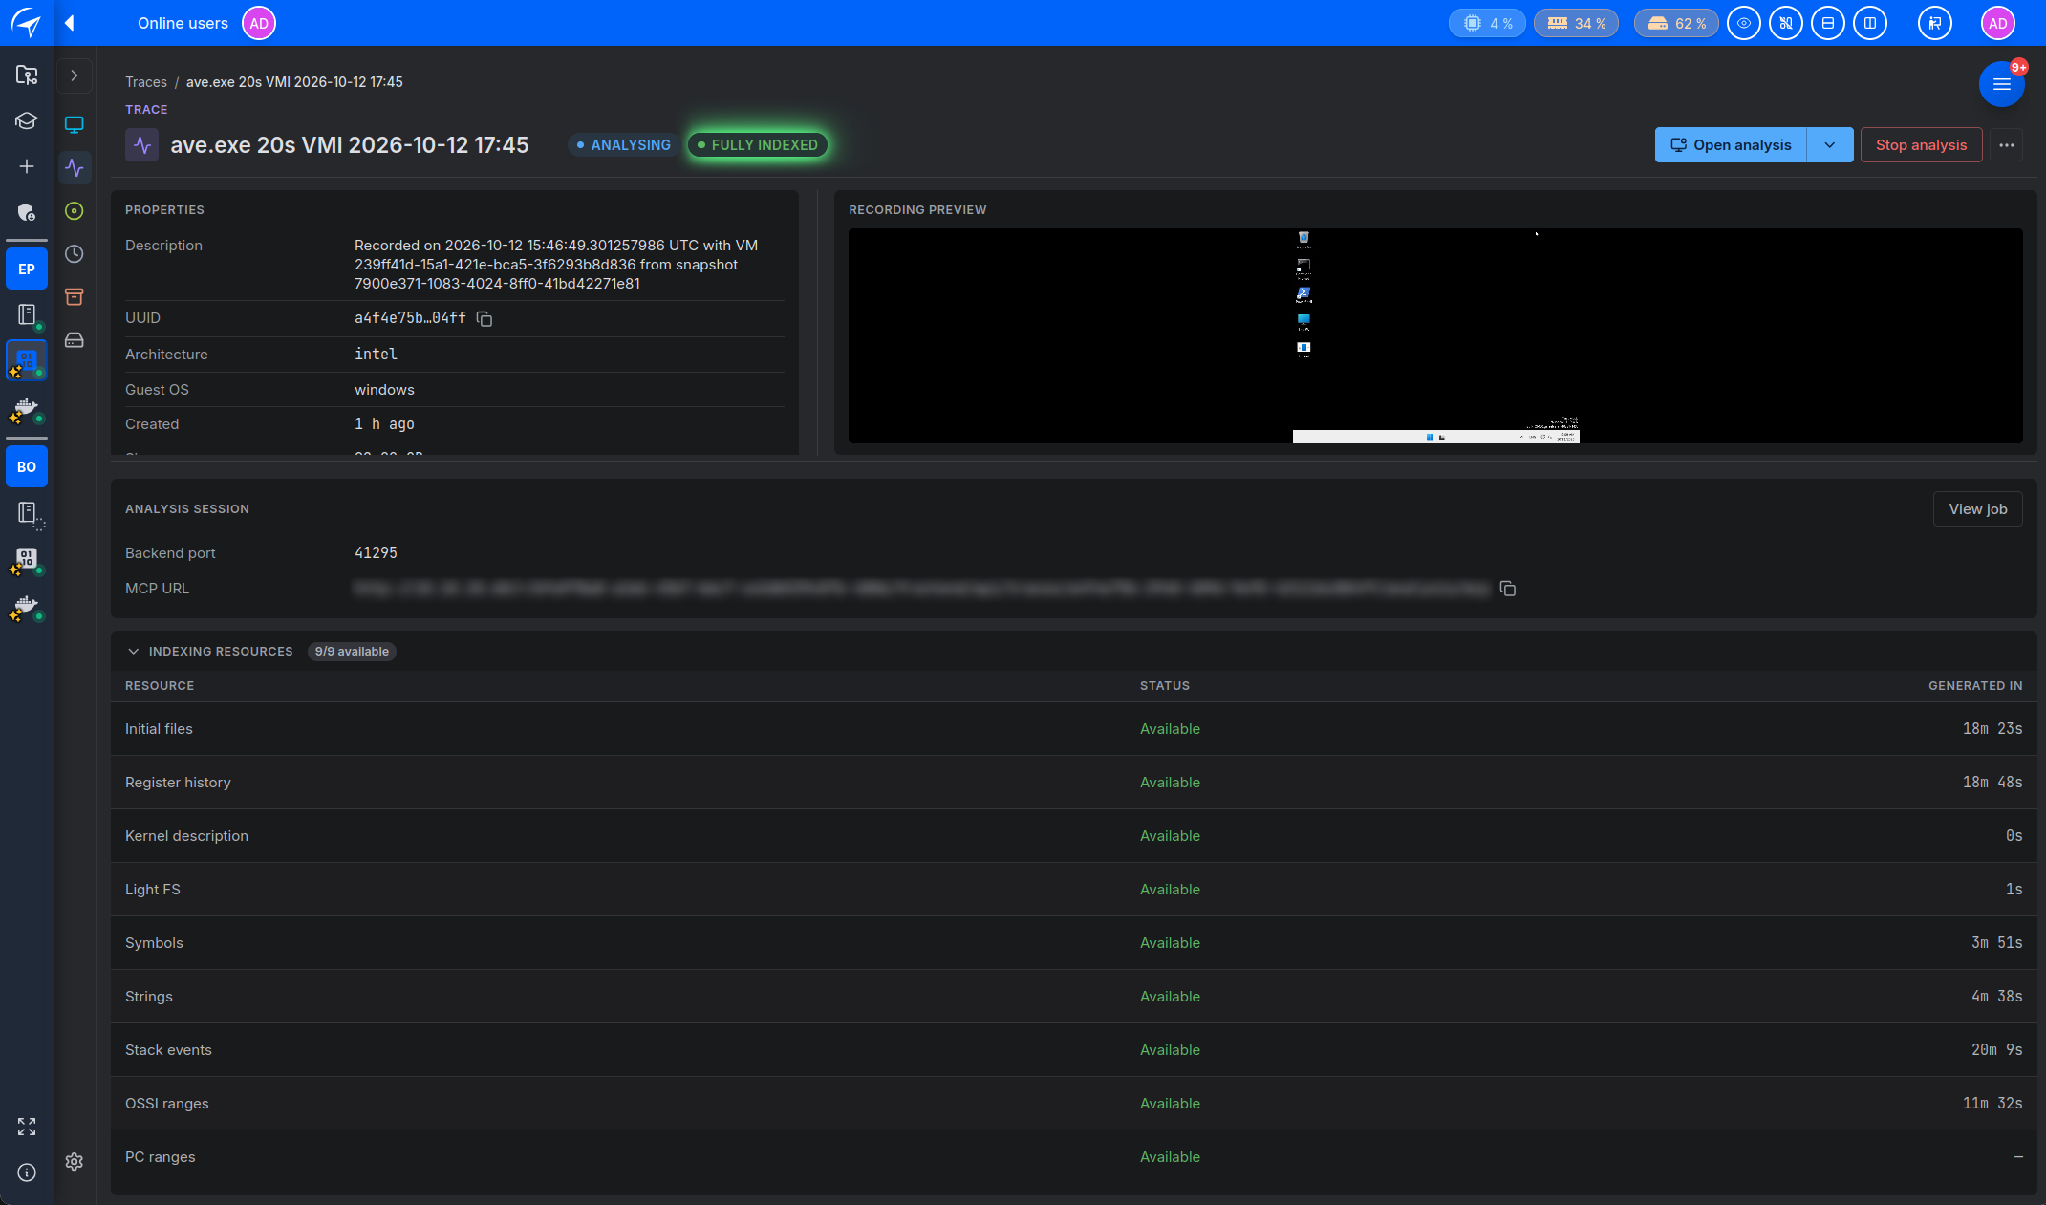
The last step is a verification. The analysis is opened and the very first transition is inspected: it is indeed the push ebp instruction at the entry point, in user mode (Ring 3), in the ave.exe process. We also check that this address is executed only once in the trace: neither a page fault nor any other interrupt occurs before the program's first instruction. This check is already a first piece of analysis: the LLM queries the trace within the same conversation.
The recording duration is therefore a setting to choose according to what you want to observe, but on its own it is not enough to predict how long indexing will take.
In a single sentence, we got what usually takes a long series of meticulous steps: a clean VM isolated from the network, a binary dropped in without any manual copying, a recording opened right on the first instruction, an indexed and verified trace, and then the VM shut down. Nothing was done in the interface, and the malware stayed locked inside an isolated VM.
And it does not require any complicated installation: connecting your LLM to Epoch's projects is very simple. Once that connection is made, the preparation is no longer tedious. You describe what you want.
At this point, the evidence is in. The trace holds the VM's entire execution over those twenty seconds, kernel included, starting at the binary's first instruction: every instruction, the state of registers and memory at any point in time and, thanks to indexing, the history of writes, the call stacks and the symbols. So you can find which instruction wrote a value, or how execution reached a given point in the code, without ever running the malware again. From here, we are free to launch the analysis: an LLM connected to Epoch through these same tools can query this trace and reconstruct, step by step, what the binary does. And there is no need to stop at verification: recording, indexing and analysis can all be requested in a single prompt. We will cover that analysis in an upcoming article.
Our team will show you how Epoch fits the way you work.
Want to explore first? Test the Epoch engine at ttd.eshard.com. Free, no sign-up, no credit card.