
AI-powered TimeTravel Debugging
Epoch captures the whole system together, including the kernel, drivers and every userland process. The resulting trace gives AI agents a deterministic source of execution evidence to investigate.
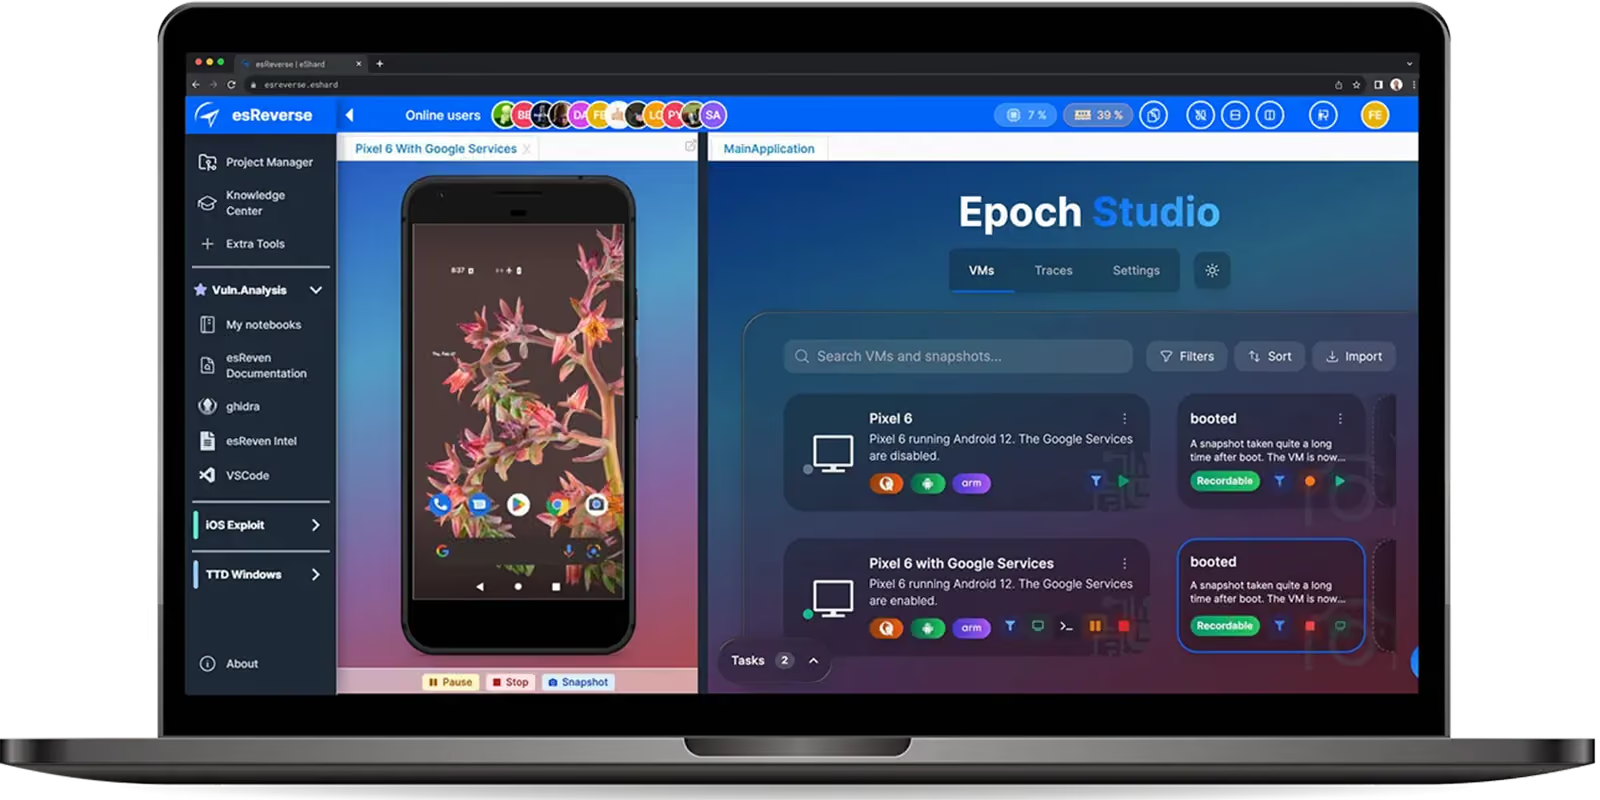
AI-powered TimeTravel Debugging
Epoch captures the whole system together, including the kernel, drivers and every userland process. The resulting trace gives AI agents a deterministic source of execution evidence to investigate.


What is Time Travel Debugging?
Time Travel Debugging (TTD) records the complete execution of a system into a deterministic trace. Unlike a traditional debugger, which observes a live execution and mostly moves forward, TTD lets you navigate backward and forward through everything that happened.
With Epoch, the AI agent or the security analyst can explore what actually happened: follow data, inspect state, trace control flow, move across processes and revisit any point in the execution as often as needed.
The trace becomes the investigation ground truth that feeds the agent with the right context for deep security analysis.
Time Travel Debugging (TTD) records the complete execution of a system into a deterministic trace. Unlike a traditional debugger, which observes a live execution and mostly moves forward, TTD lets you navigate backward and forward through everything that happened.
With Epoch, the AI agent or the security analyst can explore what actually happened: follow data, inspect state, trace control flow, move across processes and revisit any point in the execution as often as needed.
The trace becomes the investigation ground truth that feeds the agent with the right context for deep security analysis.
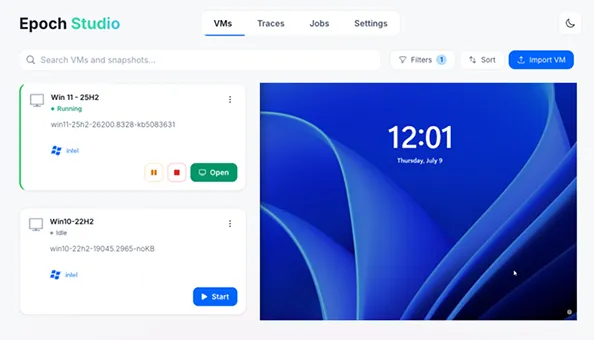
Capture the entire system execution
Capture the full execution in one pass, with intermediate states preserved as snapshots. Every instruction, memory change, and register state lands in a persistent trace file.
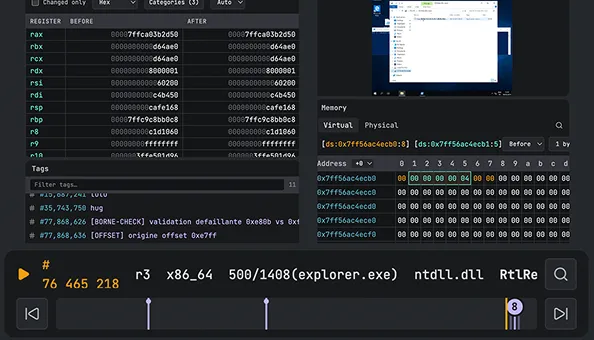
Navigate the timeline forward or backward
Move forward or backward, or jump straight to a specific instruction. The state is frozen, so even race conditions and kernel panics are fully reproducible.
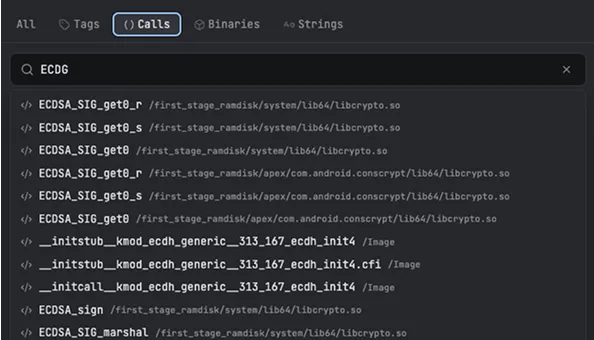
Tag, search, and inspect the trace
Tag events on the timeline, pull up symbols, and search the trace for specific strings. Memory state is available at every instruction.
Capture the entire system execution
Capture the full execution in one pass, with intermediate states preserved as snapshots. Every instruction, memory change, and register state lands in a persistent trace file.
Navigate the timeline forward or backward
Move forward or backward, or jump straight to a specific instruction. The state is frozen, so even race conditions and kernel panics are fully reproducible.
Tag, search, and inspect the trace
Tag events on the timeline, pull up symbols, and search the trace for specific strings. Memory state is available at every instruction.
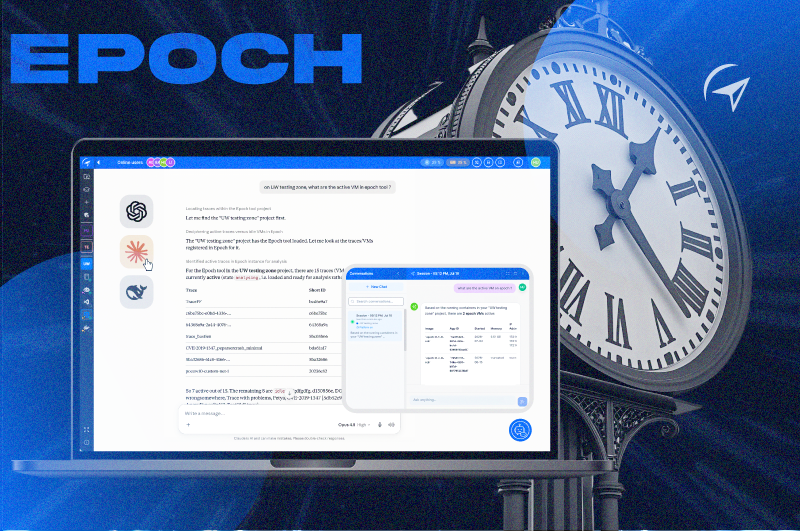
Query your trace with local Agentic AI
Connect your LLM via Epoch's dedicated MCP server. Because the dynamic chaos is now a structured, static dataset, the AI can explore millions of instructions, flag vulnerability patterns, and surface the root cause directly, then tag the trace and hand you back to Epoch Analysis to get evidence.
See what querying your trace looks like. 👉

Try it on a real trace.
A live, browser-based to create a first experience of Epoch Analysis and Epoch AI.
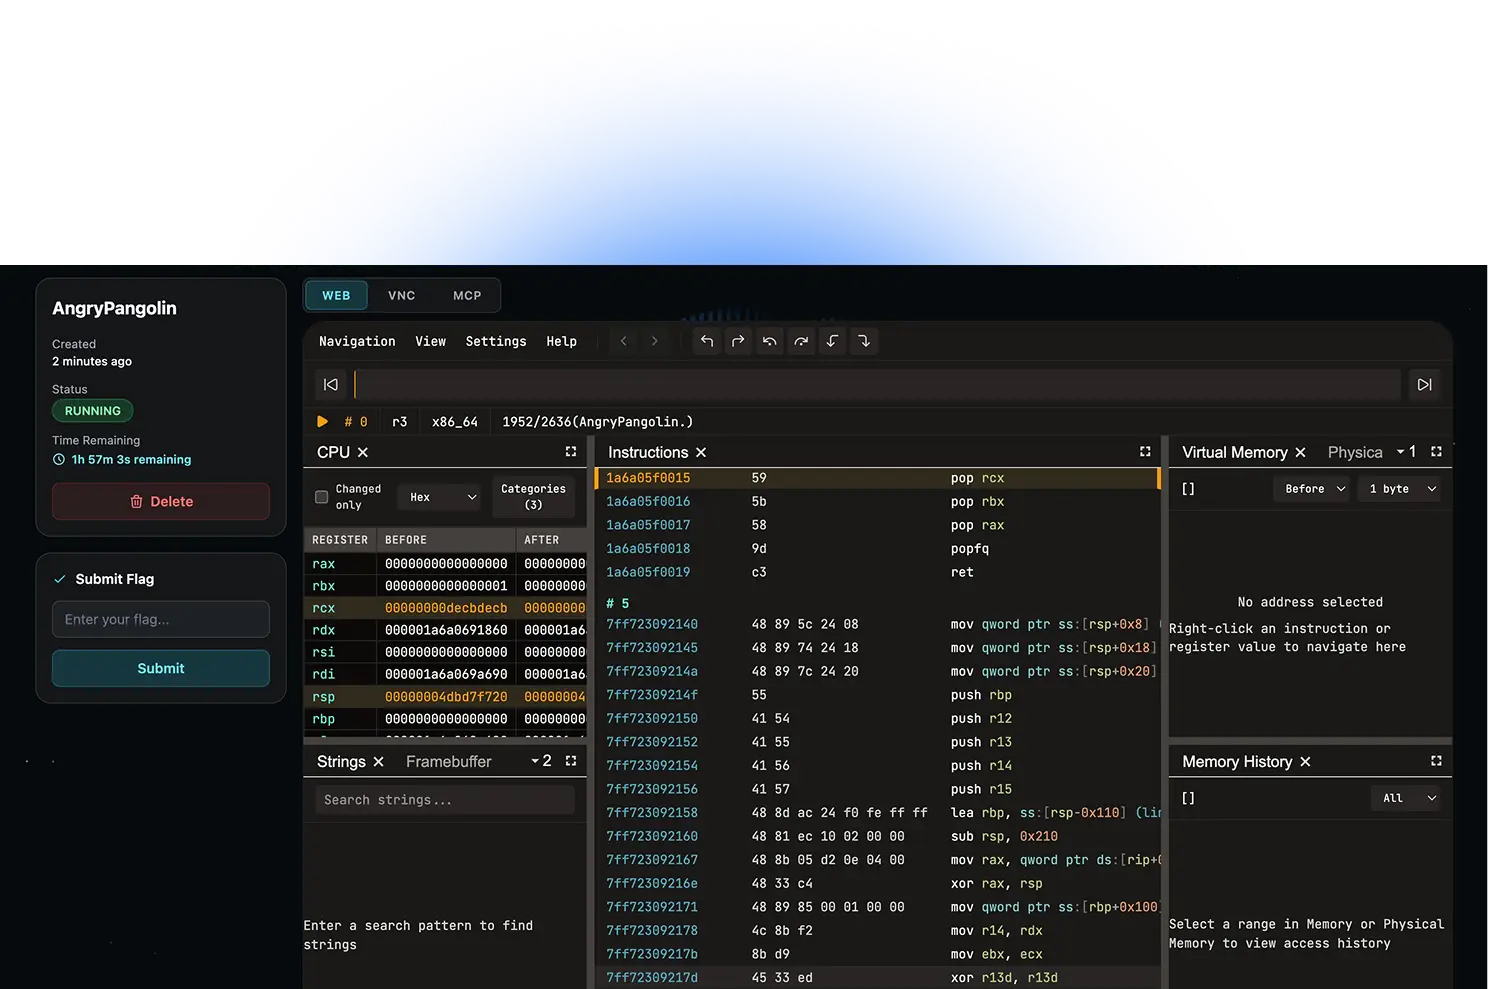
Where traditional debuggers stop, Epoch keeps going.
Traditional Debuggers
Epoch Time Travel Debugging
Full-system tracing for Linux & Windows
Full-system tracing for Android, Linux & IoT
Requires Android Emulator for TTD
QEMU-based Android VM
See Epoch on your own investigations
Leave your details and a specialist will walk you through time travel debugging and AI search on your own targets.
Learn from
Technical Articles

Frequently Asked Questions

They serve different purposes. Epoch is built for full-system visibility, Windows, Linux, Android, IoT, with an unfiltered view of the kernel and all active processes at once, for deep reverse engineering and threat analysis.
LLMs need deep context, which traditional debuggers can't provide. Epoch turns execution into a static, searchable dataset, so an AI agent can navigate millions of instructions via our MCP server, finding root causes manual stepping would miss.
Yes. Epoch doesn't replace disassemblers or debuggers, it complements them. They help you understand the code, Epoch helps you understand the execution.
Standard dynamic analysis only moves forward. Because TTD records the entire system state deterministically, exploring the trace is like scrubbing through a video, you can step backward from a crash as easily as forward.