


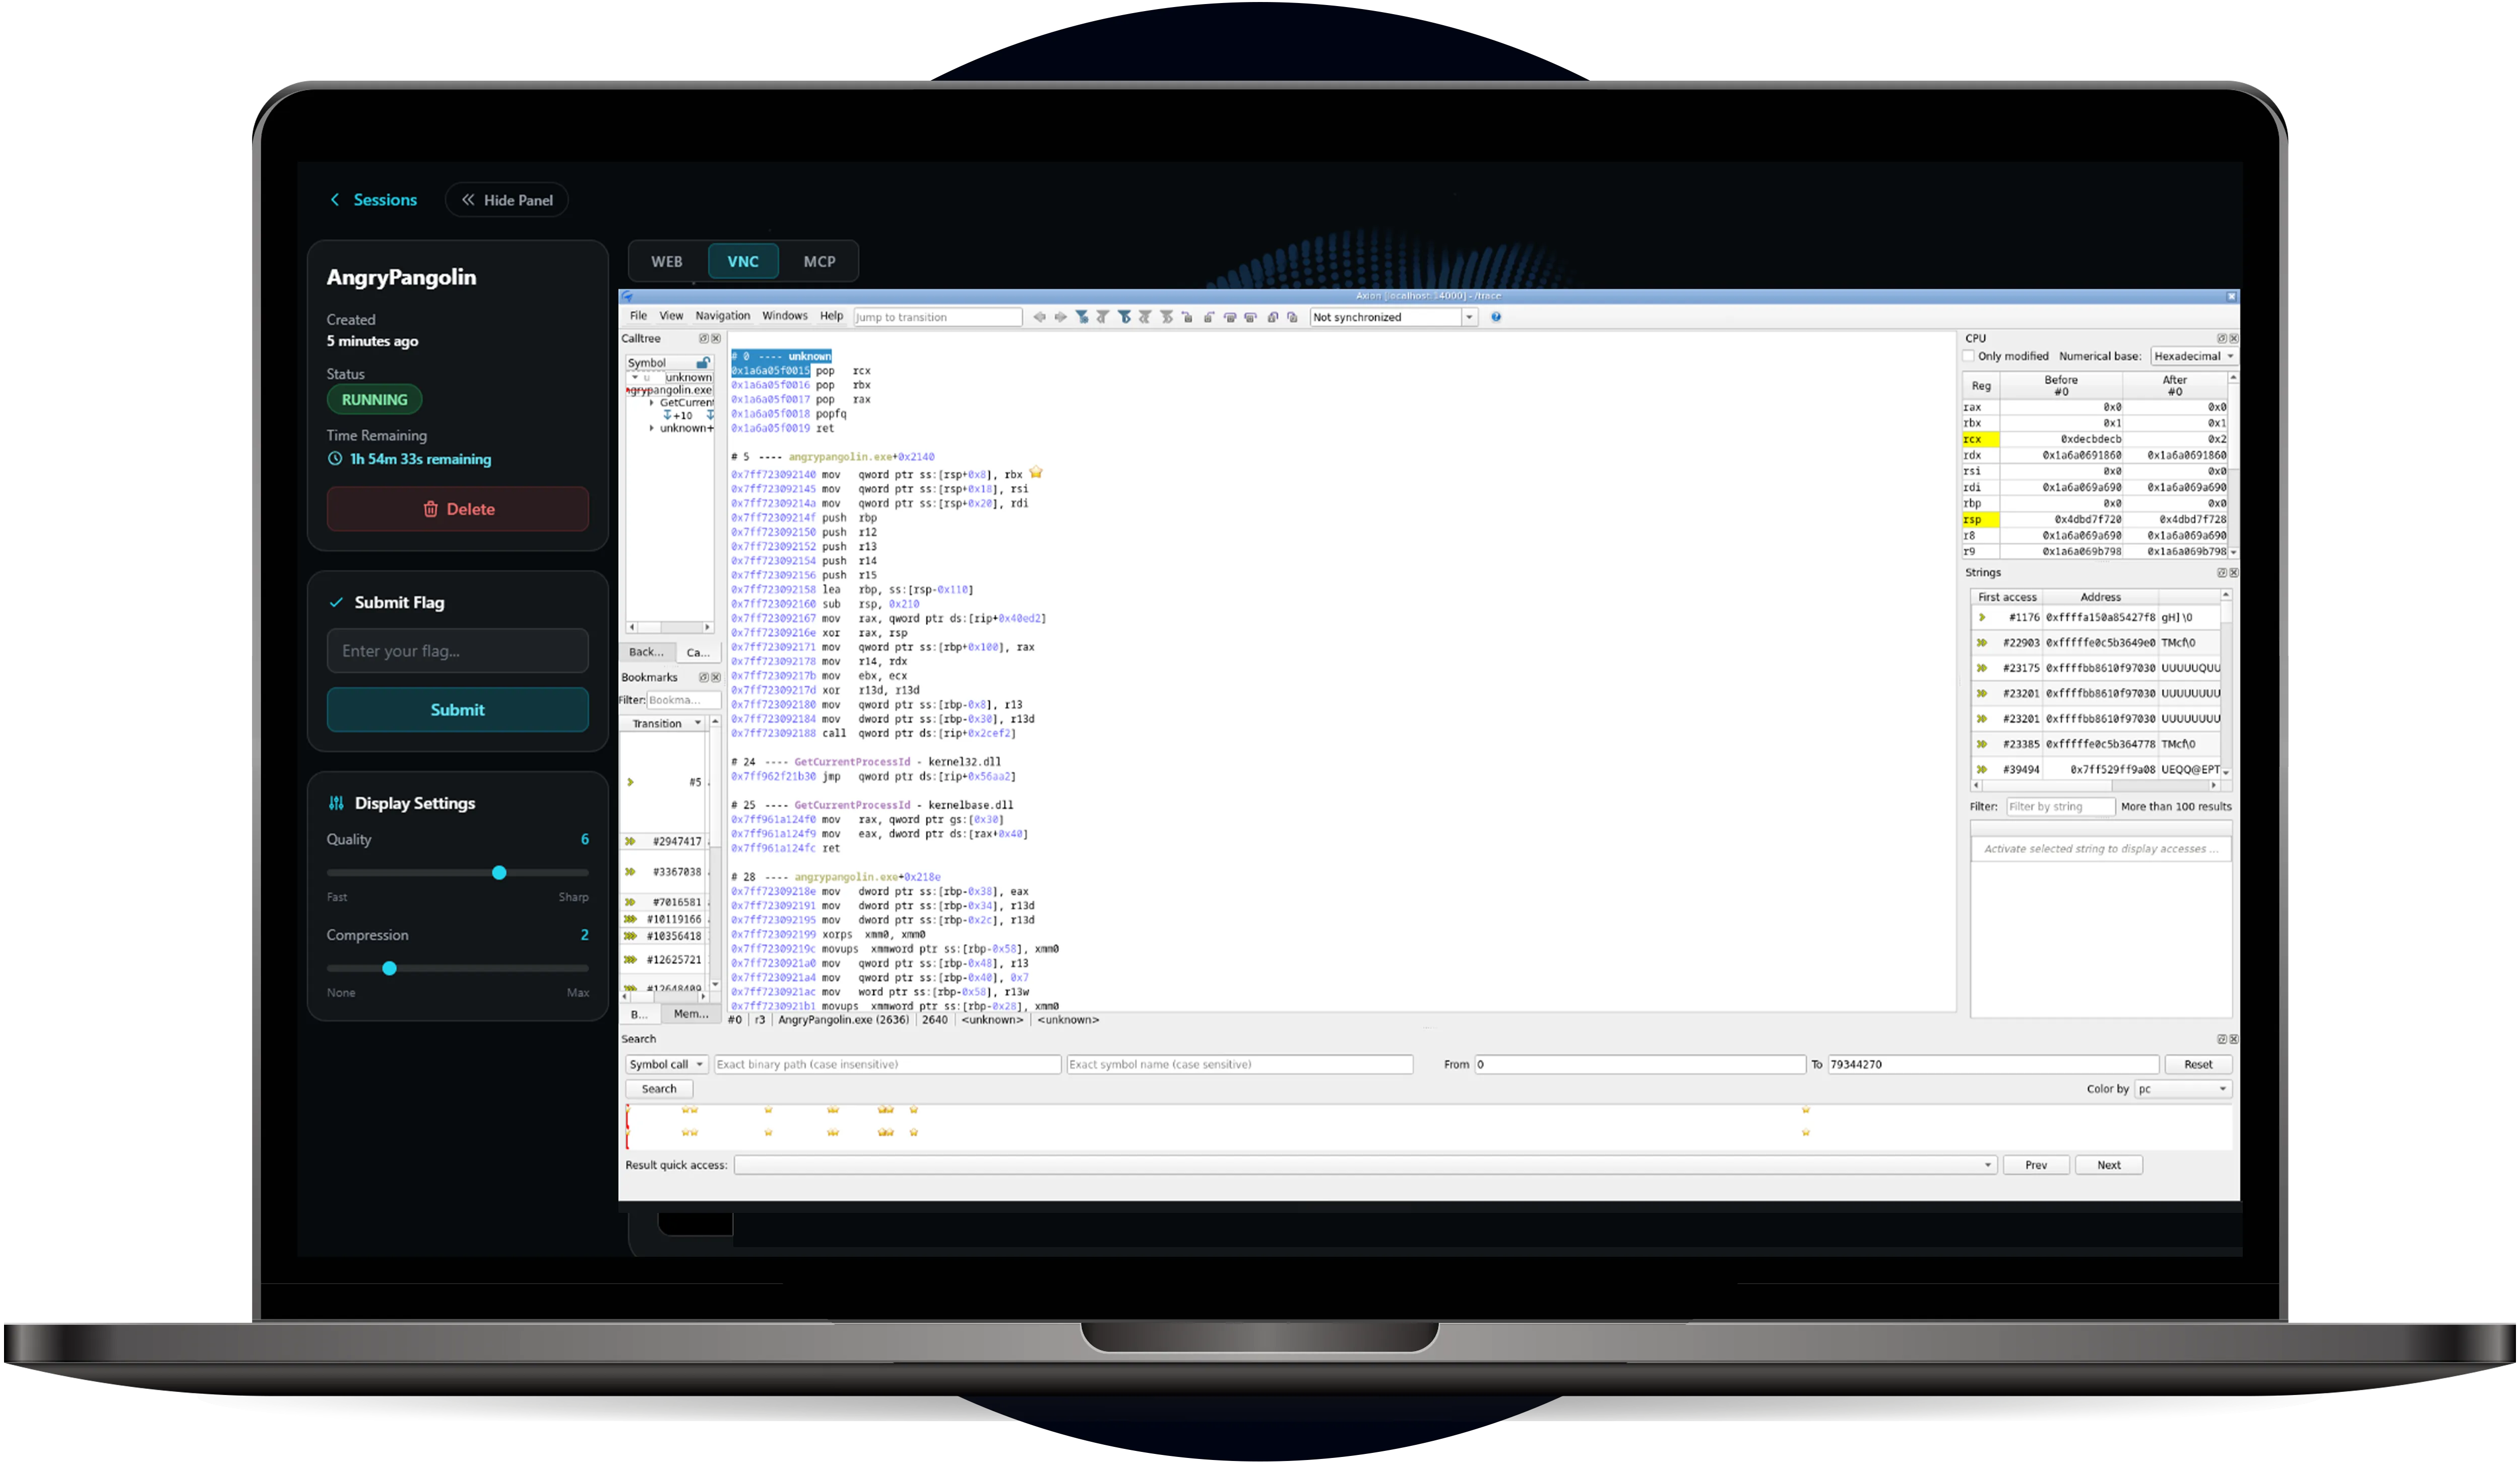
How TTD works
in practice
Our solution transforms dynamic execution into a structured, collaborative asset for deep-dive analysis.


Amplify your analysis
In esReverse, every trace captured is instantly a shared collaborative asset. Analyze the same execution data together and feed findings into other reverse engineering tools within the same workspace.
Full-system visibility
Capture the entire OS (registers, memory, kernel) to see exactly how an exploit behaves across the whole system, not just inside a single application.
Navigate the persistent dataset
Your execution becomes a permanent dataset. Step backward and forward through kernel and userland flows for exact root cause analysis without re-running the target.
Automate with agentic AI
Connect an AI agent via the dedicated MCP server to navigate millions of instructions and extract the exact insights you need in natural language.

Switch targets without switching workflows
You get the exact same full-system execution tracing experience whether your target is Windows, Linux, or Android.

Intel
Windows & Linux
Traces the entire OS — kernel, drivers, and user space simultaneously. No boundary between user-mode and kernel-mode analysis.

ARM
Android
Full system recording via the Android emulator. Analyze native libraries, kernel interactions, and everything in between.

ARM
Firmware
Designed for embedded targets with no OS. Minimal footprint, maximum coverage of firmware execution with no OS dependency.
Try the Time Travel
Debugging for yourself
Try the Time Travel
Debugging for yourself.
Access esReverse
for your investigations
Time Travel Debugging is built right into esReverse. Combine it with our full suite of reverse engineering tools to accelerate your vulnerability research.
Frequently Asked Questions

A traditional debugger can simply not go back in time. Because this is a live execution. However TTD did record everything: process, memory, instructions, etc. Analysing is like replaying a movie, it is possible to go back in time and therefore manage backward debugging as well as forward.
Standard debuggers only move forward. If you overshoot a bug, you have to restart the whole process. TTD lets you step backward from a crash to see exactly what caused it.
While both solutions serve distinct purposes, they offer vastly different capabilities. eShard’s TTD is engineered for comprehensive system visibility, supporting multiple operating systems and providing an unfiltered view of the kernel and all active processes. It is specifically designed for reverse engineering and the analysis of advanced threats.
It connects a local LLM to your trace via an MCP server, turning the execution into a searchable database. Instead of manual stepping, you ask questions like "find where this pointer was allocated" in natural language. The agent navigates the millions of instructions to find the root cause for you, keeping your sensitive data private and offline.