Tiana Razafindralambo
|
0
|
March 13, 2025


Debugging a mobile application can feel like searching for a needle in a haystack. When an app crashes or behaves unexpectedly, traditional debugging tools force you to rerun the program and hope to reproduce the issue.
But what if you could record the entire execution and analyze it at any point in time without having to restart?
This is where time travel analysis comes in.
A time travel debugging tool lets you record an application’s execution and rewind or fast-forward through the process, making it easier to track down bugs, optimize performance, and uncover security vulnerabilities. Unlike standard debugging, this approach allows you to revisit any moment in the execution without re-executing the code.
Beyond just debugging a mobile application, the ability to record the entire system state, including kernel operations and userland processes, is a game-changer for mobile application security testing. This level of visibility is particularly valuable for:
In previous articles, we demonstrated how this technique works on Windows platforms, where an entire operating system execution could be recorded.
Now, we are applying it to Android applications.
In this article, we will show how to record execution traces of popular mobile apps like Spotify, Telegram, and Amazon using esReverse’s unique Time Travel Debugging tool. With its full-system Android emulation, esReverse replicates a Pixel 6 running Android 12, creating an ideal setup for mobile application security testing.
For now, we will focus on the recording process, capturing every detail for future analysis.
Let’s get started.
Before diving into the actual recording process, the first crucial step is identifying the operation or event we want to capture.
For our examples, we’ll focus on specific moments while the user interacts with the apps:
These moments are interesting to analyze because we assume they involve significant operations:
Once the operation is identified, the next step is to prepare the application so it’s ready for recording.
The goal here is to minimize unnecessary actions during the actual recording session. Without preparation, I may risk capturing irrelevant operations, which could make analysis tedious and overwhelming.
To prepare for recording the apps, the following steps are generally required:
We are going to start by creating new VM disks as the emulator requires them to find everything that is required to properly boot Android.
$ start_android create --disks ~/my-space/disks
*** Creating '/home/reven/my-space/disks'...
*** Copying disks (this may take some time)...
$ ls ~/my-space/disks
sda.qcow2  sdb.qcow2  sdc.qcow2  sdd.qcow2
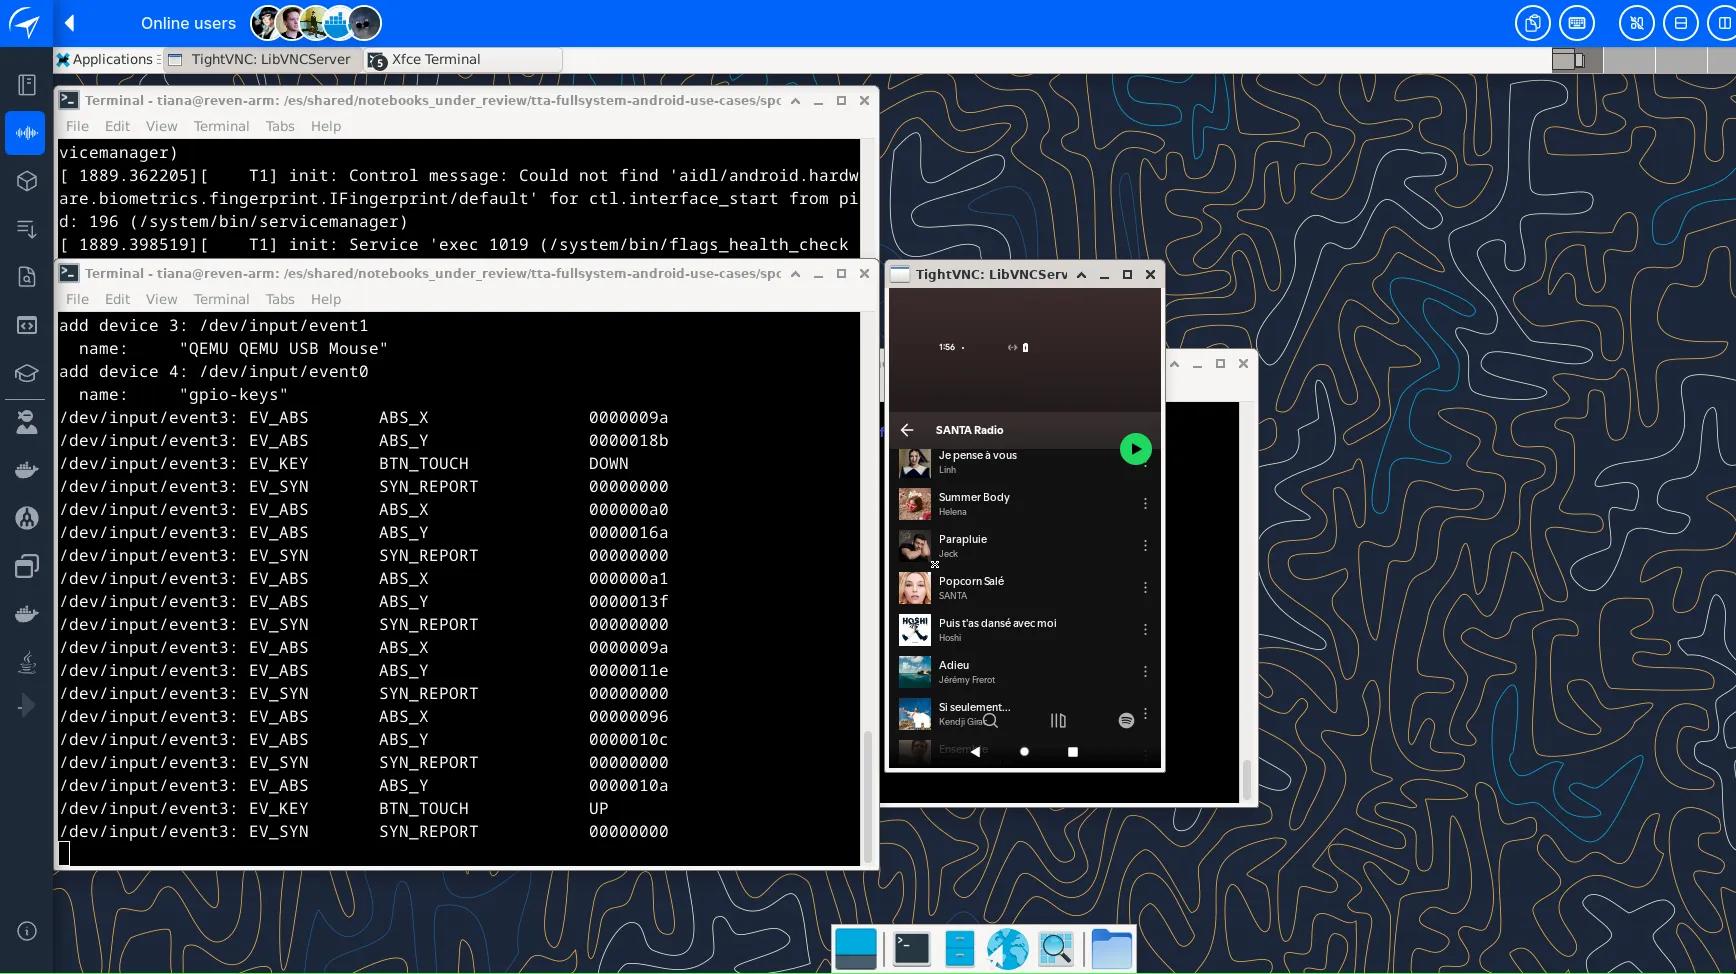
Like shown below, we are going to use the command start_android run to start the emulator.
$ start_android run --disks ~/my-space/disks
*** Running '/home/reven/my-disks/disks'
qemu-system-aarch64: invalid accelerator kvm
qemu-system-aarch64: falling back to tcg
[  955.909232][    T1] init: Control message: Could not find 'android.hardware.radio@1.6::IRadio/slot1' for ctl.interface_start from pid: 197 (/system/bin/hwservicemanager)
[  956.164435][    T1] init: Control message: Could not find 'android.hardware.nfc@1.2::INfc/default' for ctl.interface_start from pid: 197 (/system/bin/hwservicemanager)
[  956.227708][    T1] init: Control message: Could not find 'android.hardware.soundtrigger@2.0::ISoundTriggerHw/default' for ctl.interface_start from pid: 197 (/system/bin/hwservicemanager)
[  956.259483][    T1] init: Control message: Could not find 'aidl/android.hardware.biometrics.fingerprint.IFingerprint/default' for ctl.interface_start from pid: 196 (/system/bin/servicemanager)
[  956.277633][    T1] init: starting service 'virtio_logcat'...
^C
Ctrl-C detected, stopping
*** Terminate VM process...
qemu-system-aarch64: terminating on signal 15 from pid 68 (/entrypoint/.venv/bin/python)
The VM runs a complete Android boot from the very beginning.
A VNC client is automatically started to expose the Android desktop.
Let’s now install the apps on the emulator. We need to configure the apps to be in a ready-to-play state. For instance, let’s make sure we’re already logged in and ready to access the app’s features that we want to trigger and record.
This process can be automated using tools like adb (Android Debug Bridge) to install the apps and sign in programmatically.
adb connect localhost:6666
adb install app_name.apk
adb shell am start <PACKAGE_NAME>/<FULL_CLASS_NAME_MAIN_ACTIVITY>
Example: adb shell am start com.spotify.music/com.spotify.music.SpotifyMainActivity
The PACKAGE_NAME and the FULL_CLASS_NAME_MAIN_ACTIVITY can be found in the AndroidManifest.xml of the APK.
adb shell am force-stop <PACKAGE_NAME>
adb shell getevent -l
adb to tap somewhere on the screenadb shell input tap 250 360
At some point, when the app is in a ready-to-play-with state, we are going to save this state as a VM snapshot so that it can be re-loaded later on.
Once we are done we can leave the VM by hitting Crl+C.
However, setting up the app is not always as trivial as just launching the app, logging in and that’s it.
Depending on the security measures that are implemented in the app, there is probably more than that to do.
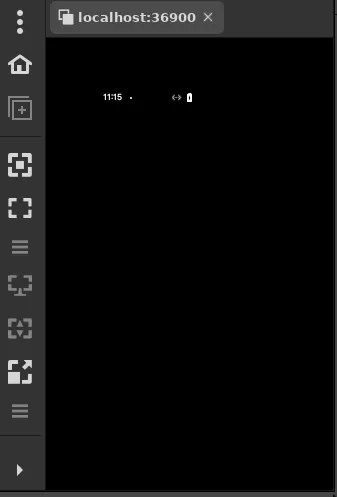
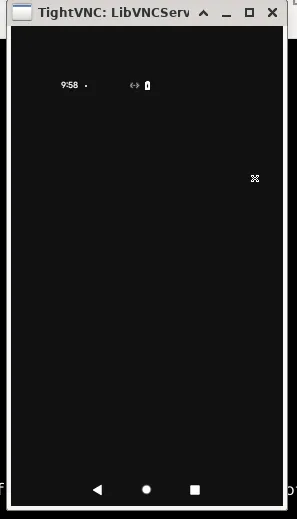
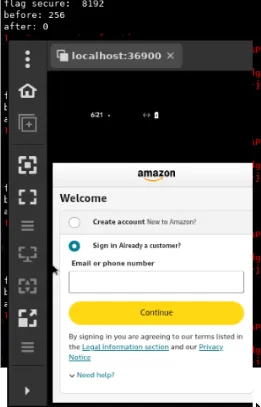
Many different issues may occur while setting up the app. One common issue is rendering a black screen on some of the app’s screens, e.g., the login screen.
There could be several reasons for the black screen, but one probable cause is the FLAG_SECURE flag being set programmatically.
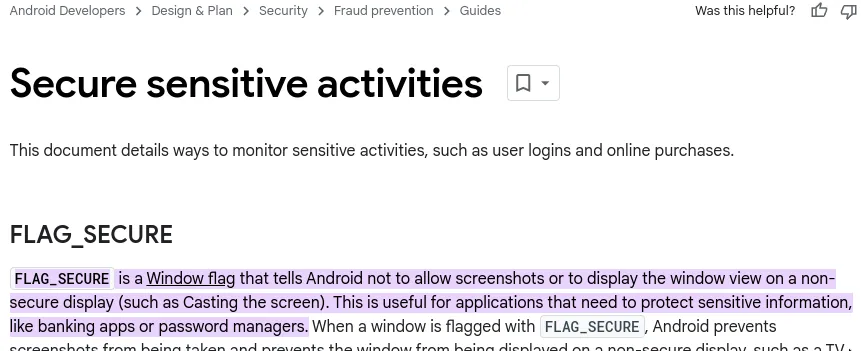
This causes screens like the ones shown below for Amazon and Spotify, making it difficult to interact with the app.
To address this, I can dump the current activity’s layout and views via adb to get the X-Y coordinates of the UI element I need to interact with:
adb shell uiautomator dump && adb pull /sdcard/window_dump.xml && xmllint --format window_dump.xml > window_dump_pretty.xml && vim window_dump_pretty.xml

adb shell input tap 9 279
Alternatively, I can use the UI Automator GUI provided by the Android SDK.
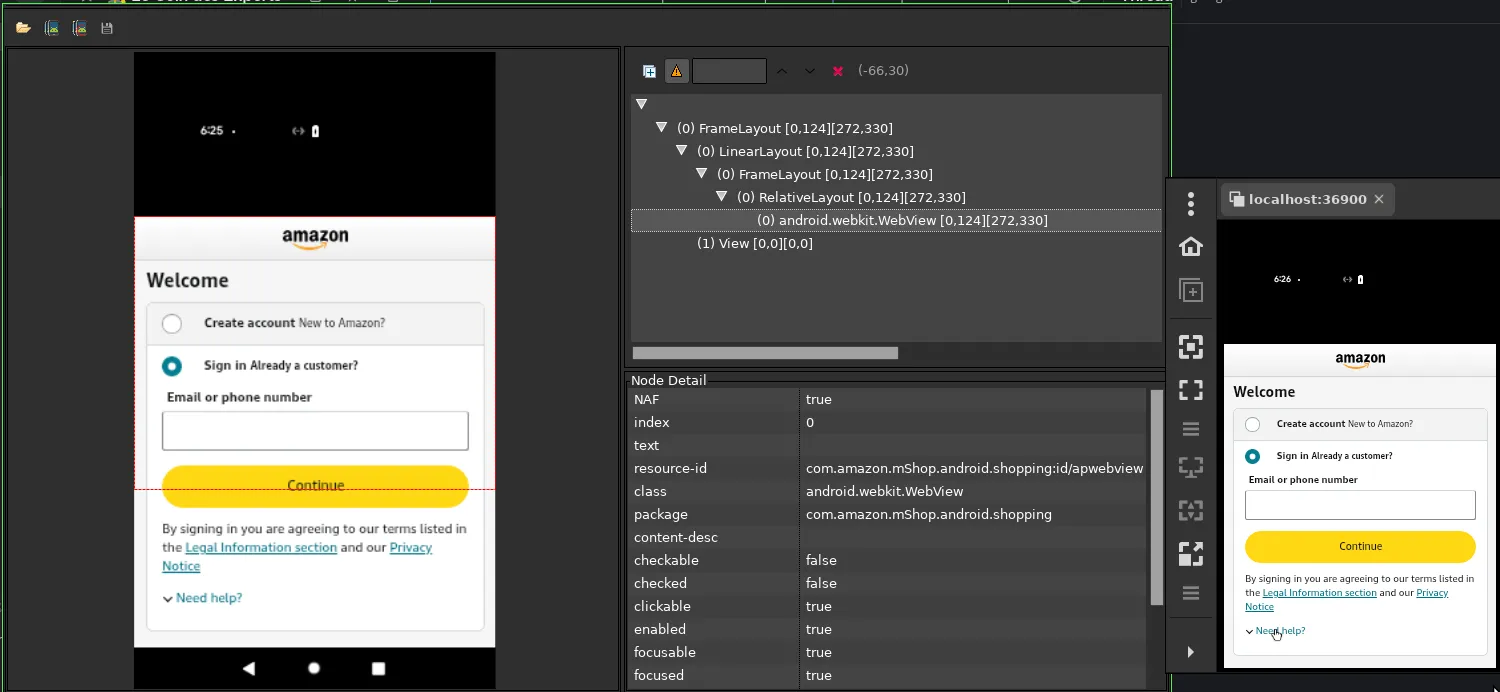
However, this method is not always reliable, as sometimes i may not be possible to retrieve the coordinates.
Instead, one can use Frida to overcome this limitation. Below is a short script that intercepts the setFlags function and removes the FLAG_SECURE flag:
Java.perform(function() {
    Java.use('android.view.SurfaceView').setSecure.overload('boolean').implementation = function(flag){
        this.call(false);
    };
    var LayoutParams = Java.use('android.view.WindowManager$LayoutParams');
    Java.use('android.view.Window').setFlags.overload('int', 'int').implementation = function(flags, mask){
        console.log('flag secure: ', LayoutParams.FLAG_SECURE.value);
        console.log('before:', flags);
        flags = (flags.value & ~LayoutParams.FLAG_SECURE.value);
        console.log('after:', flags);
        this.call(this, flags, mask);
    };
});
When this script is executed, it removes the FLAG_SECURE flag off of the current window as soon as the app tries to set it, preventing the black screen and allowing us to continue setting up the app.
frida -U -l ./telegram/frida/script.js -F -t 300
Note that we use the timeout parameter -t 300 so that FRIDA does not gives up waiting. Indeed, we are executing FRIDA and the app on an emulator. Everything is slower than on an regular actual device.
As a result there is no black screen anymore.
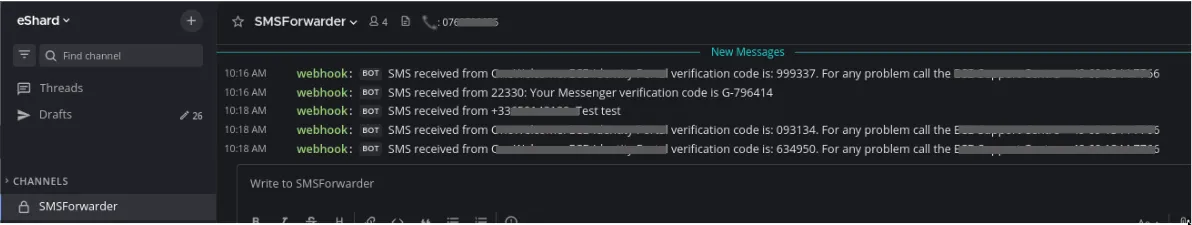
Another challenge I faced is managing two-factor authentication (2FA), as I did with Telegram.
To record the moment when a given account receives a message, I had to create a new account. Telegram requires a real phone number to send an SMS OTP for two-factor authentication.
To handle this, we:
This way, when the app on the emulator requests the phone number and triggers the SMS OTP, I can receive and enter the OTP in a few seconds without needing the testing mobile device at hand.
We want to minimize the number of actions performed during the recording because:
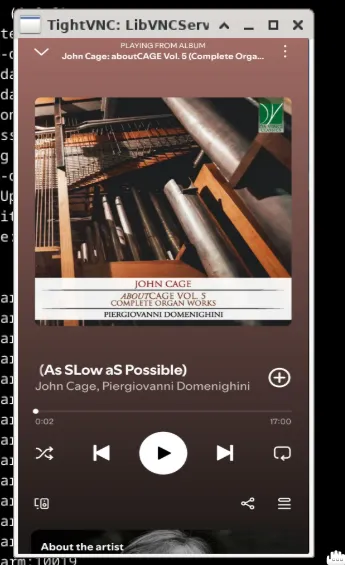
For example, with Spotify, the main action is playing a track. The app should already be logged in and ready to play a song from the user’s library or playlist. This step was done when preparing for the recording when we saved a snapshot.
Minimizing pre-playback operations ensures that only the relevant actions (those involved in playback) are captured.
For Telegram, we want the app to be opened on the user’s message screen.
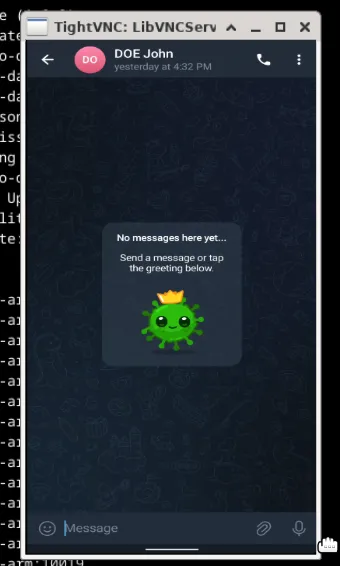
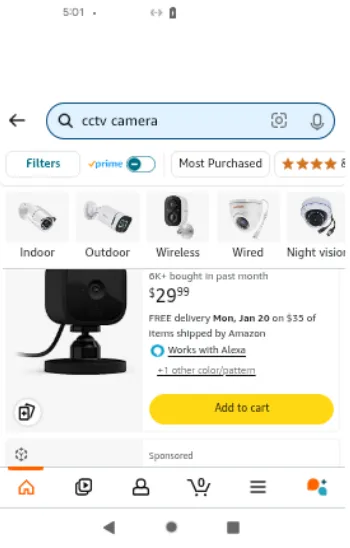
And for Amazon, the app should be on the screen where the item is ready to be added to the shopping cart.
Creating a snapshot is essentially taking a “snapshot” of the system at a particular moment in time, marking the point from which the recording will begin.
I can create a snapshot right before performing the action I want to record. This ensures that only the most relevant actions (those involved in playback) are captured when the recording begins.
To create a snapshot, connect to the local VM instance and type the savevm command with the name of the snapshot:
nc localhost 7000
savevm spotify_ready
Then I can quit the VM. Just hit Ctrl+C in the terminal where I ran start_android.
With everything set up, including a snapshot to return to, we can now start the recording.
The key feature of esReverse’s time-travel analysis is that it records not just the current state but tracks the entire history of the system’s operations leading up to that state. This allows us to “travel back in time” and examine previous states of the app.
To start recording, we’ll run the emulation in record mode and provide a few parameters:
In the example below, we load the snapshot where Spotify is ready, i.e., the app is launched, we’re logged in and a song is selected. All that’s left to do is press play.
start_android record -d <PATH_TO_QCOWS> -s spotify_ready --trace <PATH_TO_TRACE_DIRECTORY>
To play the music, we can use adb to click on the play button:
adb connect localhost:6666
adb shell input tap 250 360
As soon as the progress bar moves (i.e., the music has been buffered), we can stop the recording by pressing Ctrl+C in the terminal where start_android is running.
Generating the trace is simple. We can just run start_reven and provide the trace directory so that it can process all the collected data into an execution trace that can then be opened and analyzed. Bear in mind that this process takes time and disk space depending on how long is the recording. However, once done, we have all the time we want to inspect the entire state of the recorded system.
start_reven --trace <PATH_TO_TRACE_DIRECTORY>
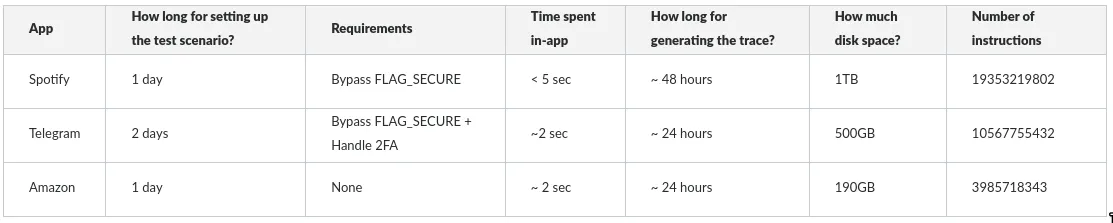
Below is a comparison table that summarizes what it takes to record those 3 android applications:
The “time spent in-app” here is the actual time it takes for a user to perform an action and see the result. Since an emulator is way slower than a real device, a single interaction can last 5 times longer than usual.
As one can see, we have collected a ton of information. And with the recorded execution trace of Spotify, Telegram, and Amazon, one can now take full advantage of the time-travel analysis to gain insights into how these apps interact with both the Android runtime and the underlying system environment.
As the trace captures the complete execution flow, it allows to examine every system interaction at a granular level, including memory management, process spawning, network communications, data encryption/decryption processes, interactions with the file system, inter process communication and many others.
This level of visibility allows for the identification of subtle attack vectors, and, if we want to, we can track how each app interacts with the kernel, system libraries, and background services, giving insights into potential attack surfaces or flaws in the app’s integration with the Android runtime.
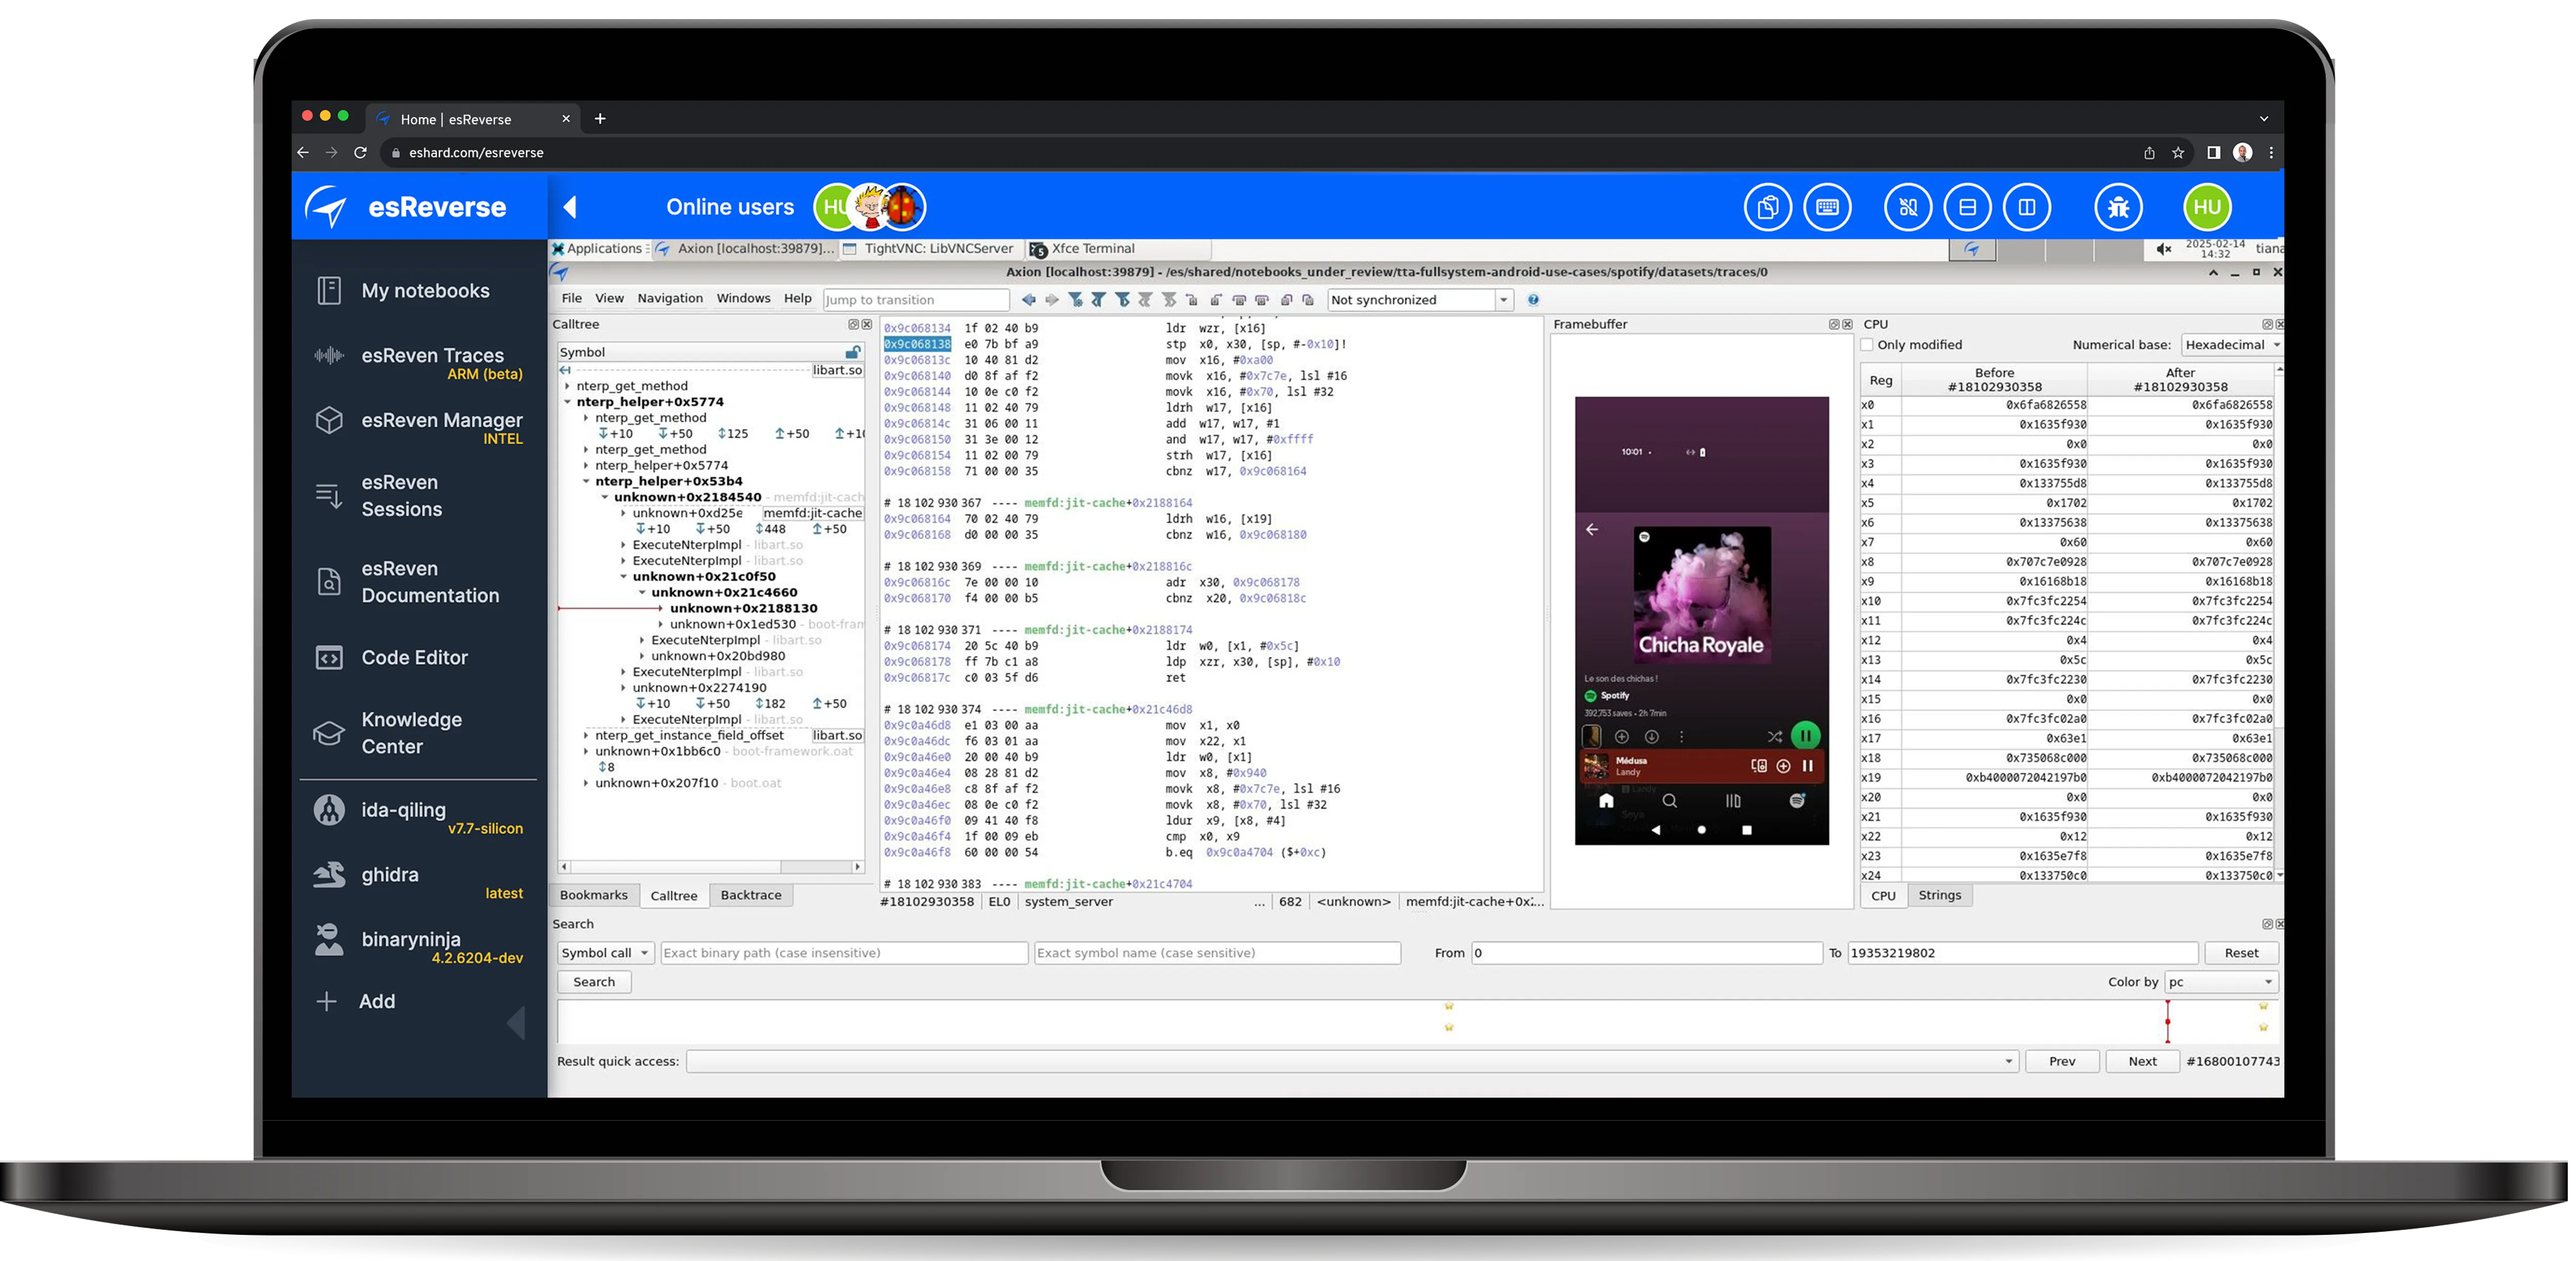
In esReverse: Time travel analysis with Android full-system emulation
Using esReverse Time Travel Debugging tool, we captured the execution of Spotify, Telegram, and Amazon, revealing the complex processes behind simple actions like playing music, sending messages, or adding items to a cart. Network communication, encryption, and memory management all leave traces that can now be explored with precision.
With the recorded execution trace, we can dig deeper. The interactive GUI lets us navigate through execution step by step, while the Python API allows automated security testing. These tools open new possibilities for mobile application security testing, debugging, and vulnerability research.
Recording an application’s execution is just the first step. The real value of time travel analysis comes from what we can do next: rewind, inspect, and analyze every detail without rerunning the app.
In our next article, we will explore how to analyze these recorded traces and extract key insights using time travel analysis. Stay tuned.


